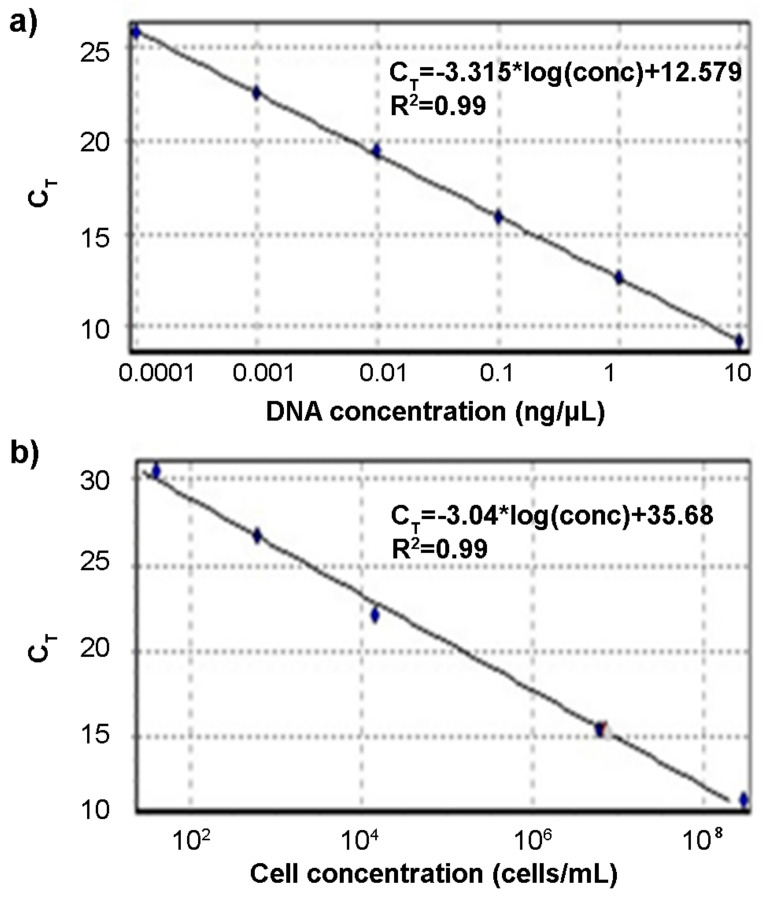
Figure 3.
Calibration curves obtained using decimal dilution of DNA (a) and Campylobacter cells (b). (a) Standard curve of serial decimal dilutions of DNA of Campylobacter jejuni DSM 4688. The curve was obtained by plotting the threshold cycle (Ct) of each DNA dilution vs. the DNA concentration (ng/μL). (b) Standard curve of serial decimal dilutions of C. jejuni DSM 4688 cells. The curve was obtained by plotting the Ct of each cell dilution vs. the cell concentration of 2.09 × 10⁸, 7.38 × 10⁶, 2.66 × 10⁴, and 5.9 × 10² cell/mL.

