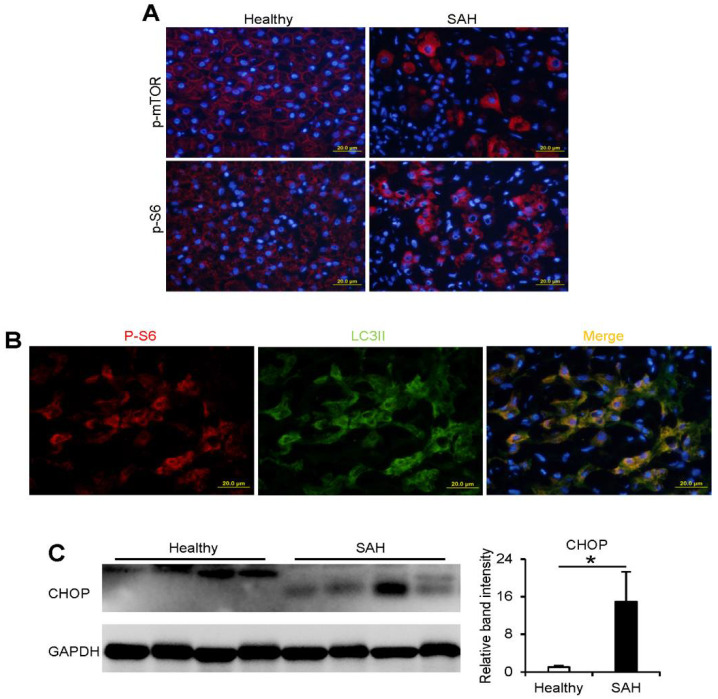
Figure 5.
Activation of mTORC1 and accumulation of CHOP in the liver of patients with SAH. (A,B) IF analysis of p-mTOR, p-S6, and LC3II in the liver of healthy subjects and SAH patients. Scale bars, 20 μm. (C) Immunoblot and quantification analysis of CHOP in the liver of healthy subjects and SAH patients. An independent T-test was performed to calculate the significance of the data (* p < 0.05).

