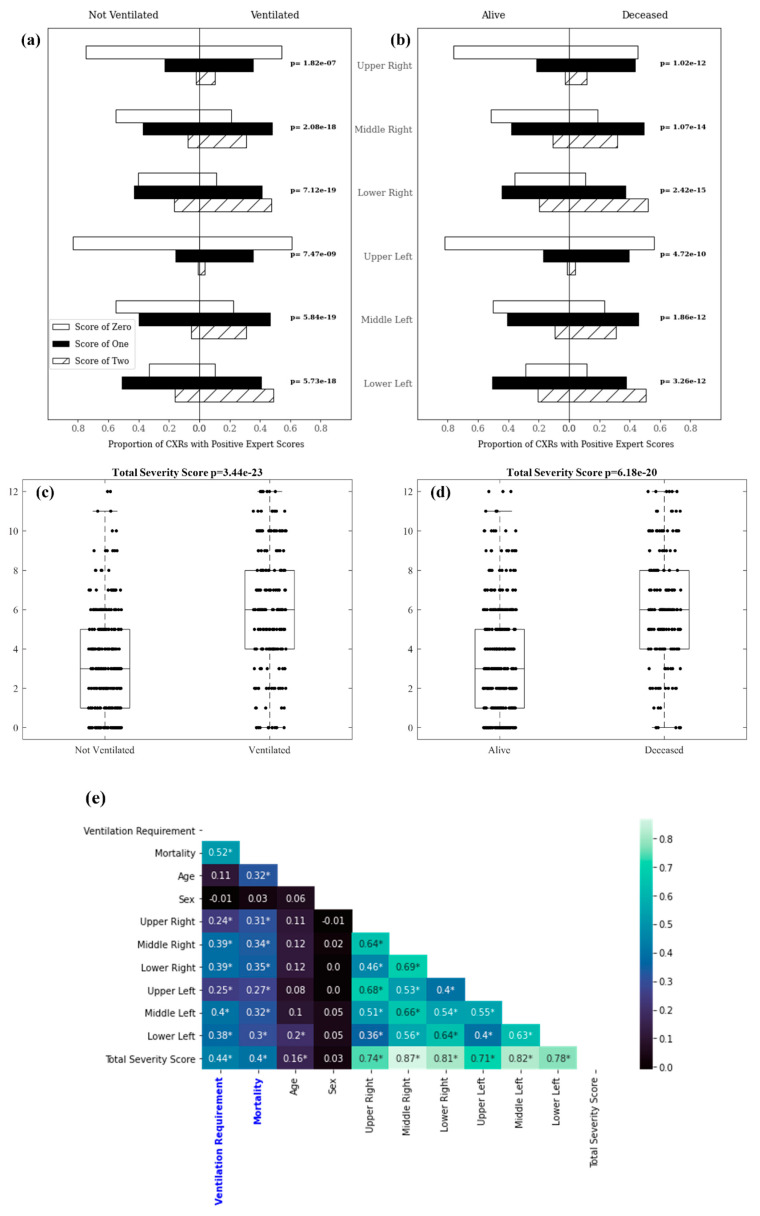
Figure 7.
Zone-wise expert scores distribution: (a) and (b) depict the proportion of patients whose CXRs had lung zone scores of 0, 1, and 2 in each pictured population; (c) and (d) visualize the distribution of total zone-wise scores assigned to CXRs for patients in each population; (e) displays correlations between zone-wise severity scores and clinical outcomes. Asterisks denote statistical significance at the level of p = 0.01 as determined by a Pearson’s correlation coefficient.

