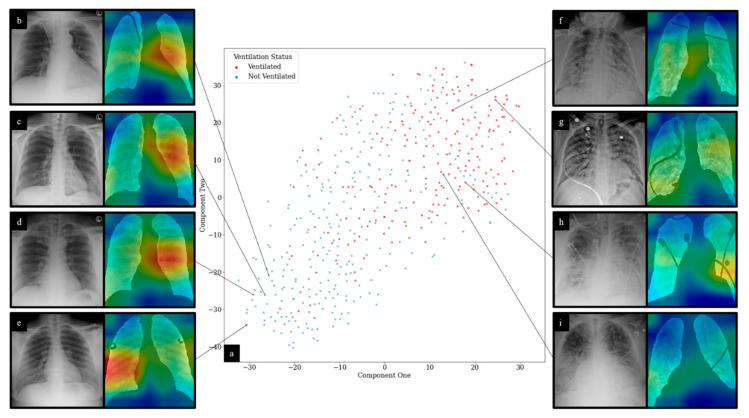
Figure 9.
t-SNE and CAM visualization of DL predictions: (a) displays t-SNE clustering of DL network outputs for ventilation prediction; (b–d) demonstrate no focal consolidation or infiltrates. CAMs show maximal signal intensity in the left middle lung zone predominantly along the perihilar region; (e) shows no focal consolidation or infiltrates. CAM shows maximal signal intensity in the right mid to lower lung zone; (f) demonstrates diffuse patchy infiltrates bilaterally, predominantly in the mid to lower lung zones. CAM shows the highest signal intensities in the right mid to lower lung zones in areas of dense infiltrates. Additionally, noted is slightly increased CAM activity in the left lower lobe around the areas of dense infiltrates; (g) demonstrates diffuse patchy infiltrates bilaterally. CAM shows the highest signal intensities in the right lower and left upper lung zones around areas of slightly dense infiltrates; (h) shows diffuse infiltrates bilaterally with relative sparing of the right upper lobe. CAM shows the highest signal intensities in the right mid and left mid to lower lung zones in areas of dense infiltrates; (i) demonstrates diffuse bilateral reticular opacities with interlobular septal thickening along with superimposed dense infiltrates predominantly in the lower lobes. CAM shows the highest signal intensity in the right lower lung zone around areas of dense infiltrates. CXR interpretation performed by J.G. (15 years of experience).

