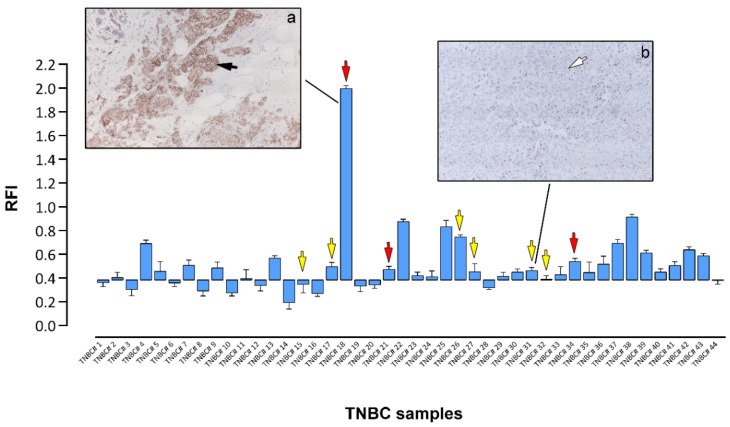
Figure 4.
Expression of c-Kit in TNBC samples. Normalized RPPA values for c-Kit were plotted using as baseline value the relative fluorescence intensity (RFI) values of samples found negative by IHC analysis. IHC images of samples stained for c-Kit and showing strong (black arrow, subpanel a) or no expression (white arrow, subpanel b) of c-Kit are presented for illustration purposes. Sequenced samples are indicated by arrows (yellow arrows no mutations detected, red arrows oncogenic mutations present). Magnification, 20×.

