FIG. 8.
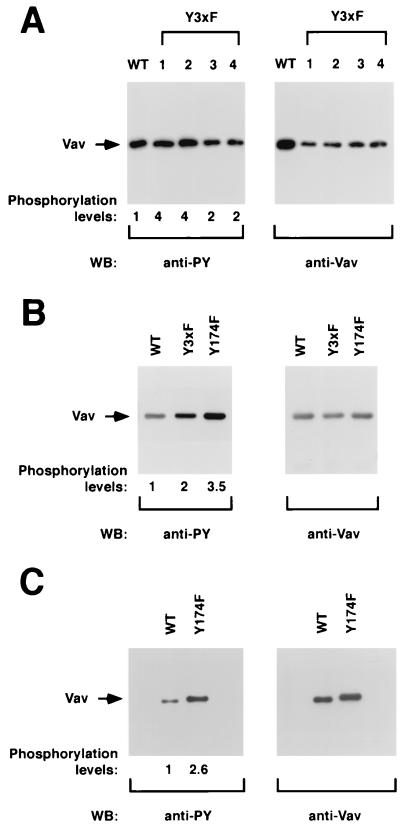
(A) Phosphorylation levels of Vav proteins in NIH 3T3 cells. One stable cell clone of NIH 3T3 cells expressing wild-type Vav (lane WT) and four independent cell clones expressing Vav Y3xF proteins (lanes 1 to 4) were lysed, immunoprecipitated with anti-Vav antibodies, and then subjected to Western blot (WB) analysis using either antiphosphotyrosine (anti-PY; left) or anti-Vav antibodies (right). (B) Phosphorylation of Vav proteins in COS-1 cells. Exponentially growing cells transfected with either wild-type Vav or the indicated Vav mutants were subjected to the same analysis as that described for panel A. (C) Phosphorylation levels of Vav proteins in Sf9 cells. Purified preparations of polyhistidine-tagged versions of wild-type and Vav Y174F proteins purified from Sf9 cells were separated electrophoretically and subjected to immunoblot analysis with the indicated antibodies. The mobilities of Vav proteins are indicated by arrows. For panel A, signals were developed either using 125I-labeled protein A (anti-Vav immunoblots) or by treatment with an anti-mouse immunoglobulin G antibody followed by incubations with 125I-labeled protein A (anti-PY). For panels B and C, signals were developed using the enhanced chemiluminescence method (ECL; Amersham). The overall levels of Vav phosphorylation (normalized by the relative amount of protein present in each case) are indicated underneath each panel. The levels of phosphorylation of wild-type Vav were given an arbitrary value of 1 in each case.

