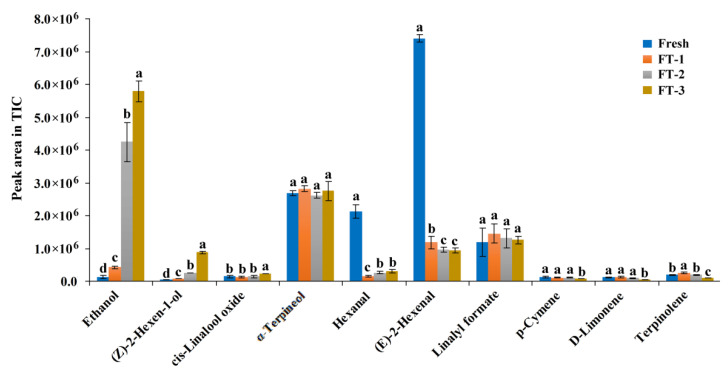
Figure 4.
The peak area in total ion chromatogram (TIC) assigned to 10 main compounds for freeze-thaw (FT) treated samples. FT-1, FT-2 and FT-3 represent the sample with FT treatment once, twice and third times. Values are presented as mean ± standard deviation (n = 2). Different letters indicate significant differences (p < 0.05).

