Figure 1.
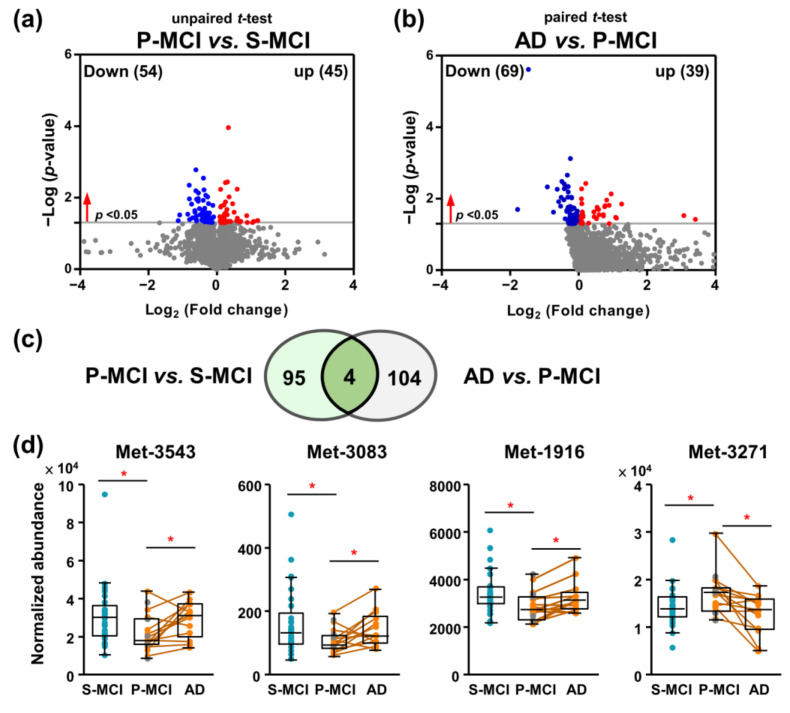
Longitudinal and cross-sectional analysis comparing the plasma metabolomic data of MCI patients. (a) Comparison of the metabolic profiles between 19 P-MCI and 29 S-MCI patients based on independent t-tests. A total of 99 metabolic features were statistically significant (p < 0.05). (b) Comparison between 13 paired P-MCI and AD groups to identify differential metabolites associated with AD development based on paired t-tests. A total of 108 metabolic features were statistically significant (p < 0.05). (c) A Venn diagram of the comparison between the P-MCI vs. S-MCI and P-MCI vs. AD metabolic features. (d) Box and whisker plots of four common metabolic for differentiating the S-MCI, P-MCI, and AD patients based on paired and independent t-tests. Paired samples are connected by lines. Grey dots represent six P-MCI subjects without AD metabolomics data. * p < 0.05. S-MCI, stable MCI; P-MCI, MCI proceeding to AD.

