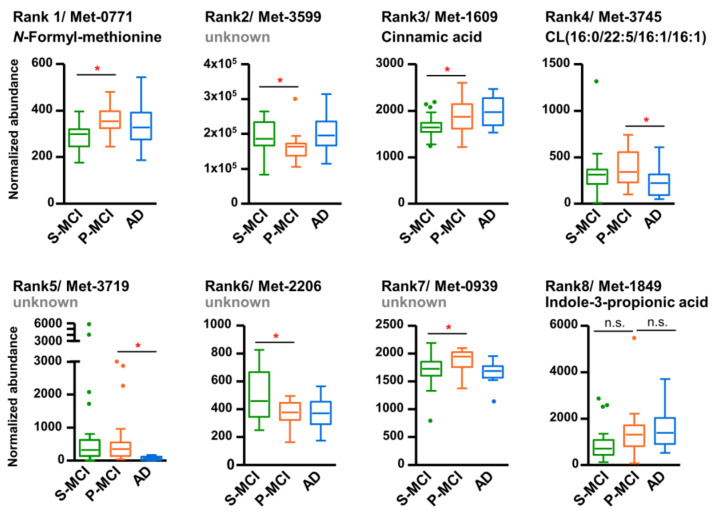
Figure 5.
Box and whisker plots of eight representative features for differentiating the S-MCI, P-MCI, and AD groups. The box defines the 25th and 75th percentile of the intensity distribution and the horizontal line within the box representing the 50th percentile (median). Outliers are defined as having an intensity exceeding 1.5 interquartile ranges lower than 25th percentile or higher than the 75th percentile, which were indicated as dots. * p < 0.05. S-MCI, stable MCI; P-MCI, MCI proceeding to AD; CL, cardiolipin; n.s., non-significant.

