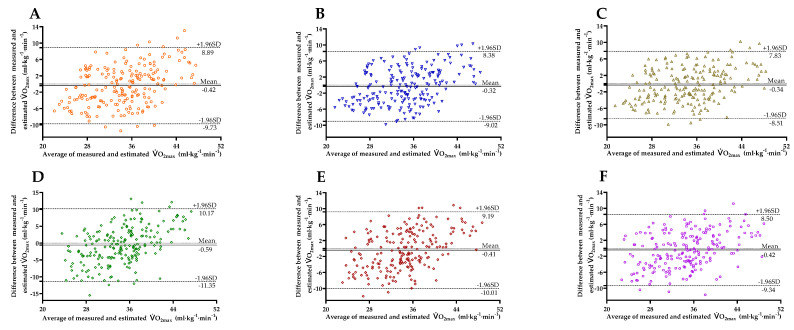
Figure 3.
Bland–Altman Plots comparing the differences between measured and estimated O2max obtained from PBF modelBC (A), PBF modelHR0 (B), PBF model∆HR3 − HR4 (C), BMI modelBC (D), BMI modelHR0 (E), BMI model∆HR3 − HR4 (F) in the entire sample (n = 205). The mean differences and 95% limits of agreement are shown as solid lines and dashed lines, respectively.

