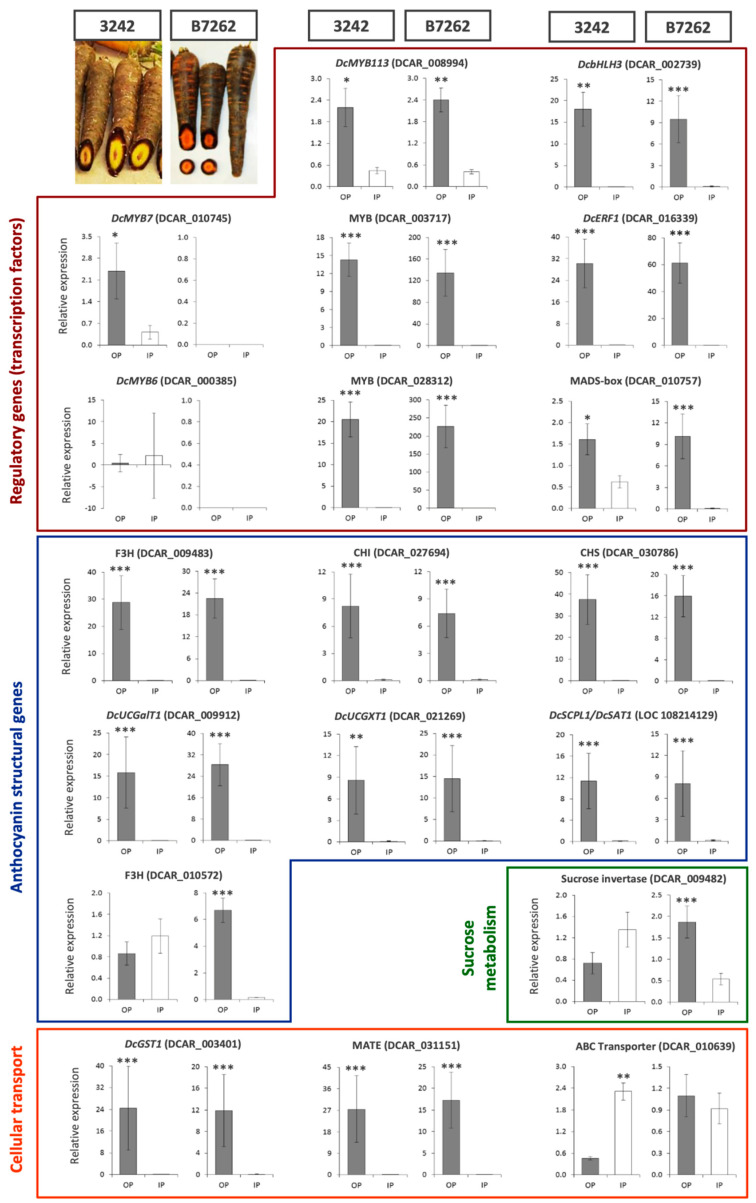
Figure 2.
Comparative analysis of transcript levels by RT-qPCR for 19 selected genes in purple outer phloem (OP) (gray bars) vs. non-purple inner phloem (IP) (white bars) tissues from roots of 3242 and B7262 genetic backgrounds. For 3242, roots from a derivative F3 family of 3242-F2 (used for mapping and transcriptomic analyses) were used. Root phenotypes for both genetic backgrounds are shown in the upper-left images. The selected anthocyanin-related genes were consistently differentially expressed in all of the POP vs. NPIP transcriptome comparisons (16 genes), and/or they colocalized with ROPAP and RIPAP in the linkage map, and/or they were previously reported to be involved in the biosynthesis, modification or transport of anthocyanins. Bars indicate mean values for the fold change in gene expression relative to the expression of the internal control gene (actin), as calculated from the ratio ∆Cq-target gene/∆Cq-actin [34] and their standard errors. Asterisks indicate significantly higher gene expression at p < 0.05 (*), p < 0.01 (**), and p < 0.001 (***).

