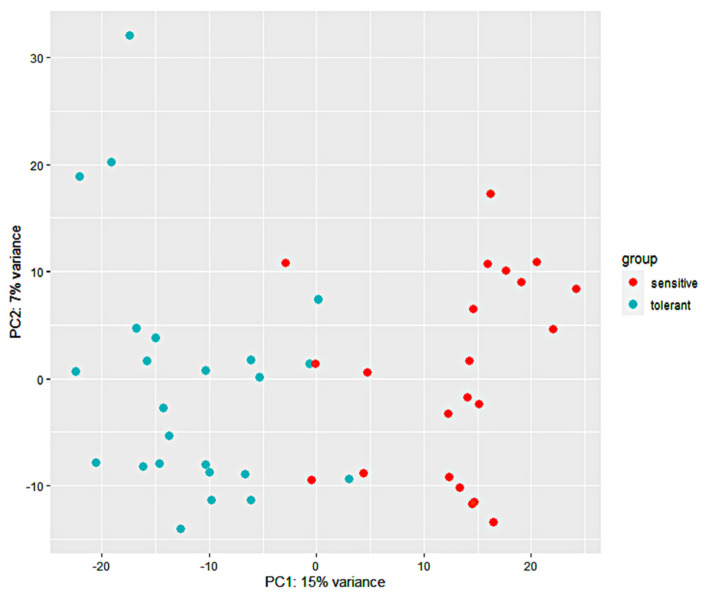
Figure 2.
Principal component analysis (PCA) of pairwise genetic distance. The grouping of the 46 maize inbred line populations is indicated using blue (tolerant) and orange (sensitive). The proportion of variance captured is given as a percentage for both the first and second principal components (PC1 and PC2).

