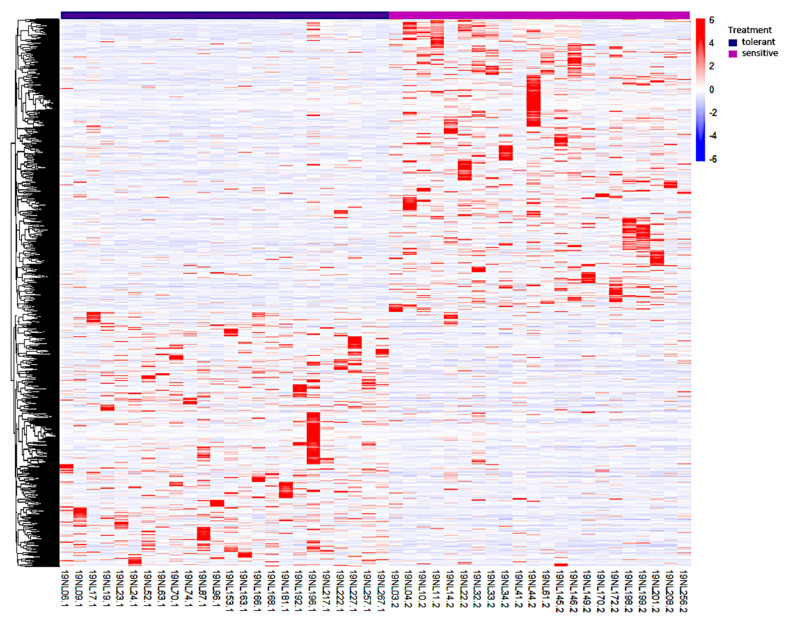
Figure 3.
Heatmap showing the clustering analysis of 2237 common cold-responsive genes. The x-axis represents different maize samples. The purple color denotes the cold-tolerant lines while the pink color represents the cold-sensitive lines. The red and blue color scale represents high and low expressions, respectively.

