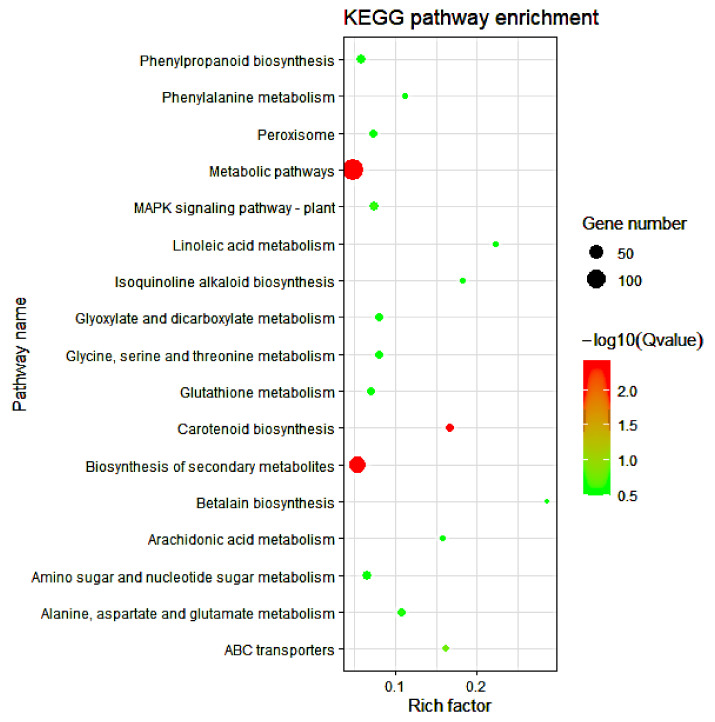
Figure 7.
KEGG pathway enrichment analysis of the 1656 common cold-responsive genes. The experimental comparisons were based on the hypergeometric test, while the significance of the enrichment of the KEGG pathway was based on q value, q < 0.05. The color gradient represents the size of the q value; the color ranges from green to red, and the closer to green, the smaller the q value and the higher the significant degree of enrichment of the corresponding KEGG pathway. The “rich factor” represents the percentage of DEGs to total genes in a given pathway.

