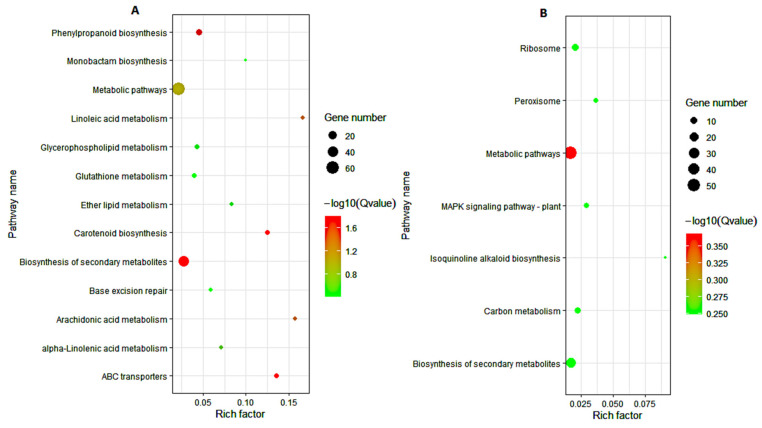
Figure 8.
KEGG pathway enrichment analysis. (A) The 779 DEGs highly enriched in the tolerant lines. (B) The 877 DEGs highly enriched in the sensitive lines. The experimental comparisons were based on the hypergeometric test, while the significance of the enrichment of the KEGG pathway was based on q value, q < 0.05. The color gradient represents the size of the q value; the color ranges from green to red, and the closer to green, the smaller the q value and the higher the significant degree of enrichment of the corresponding KEGG pathway. The “rich factor” represents the percentage of DEGs to total genes in a given pathway.

