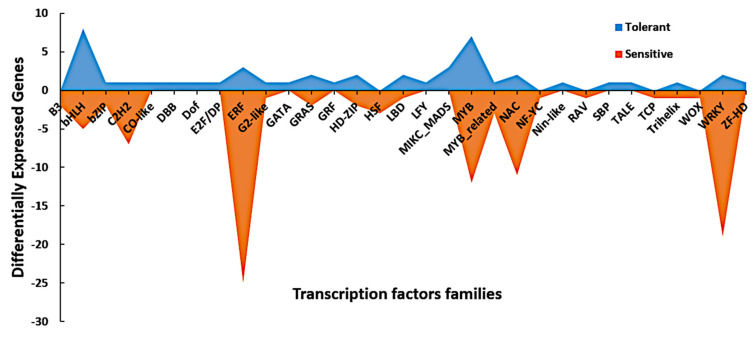
Figure 9.
Area map of the various transcription factor families regulated by cold stress. The x-axis represents the TF families, while the number of genes per family is represented by the y-axis. The blue and orange colors indicate the TFs regulated in the tolerant and sensitive lines, respectively.

