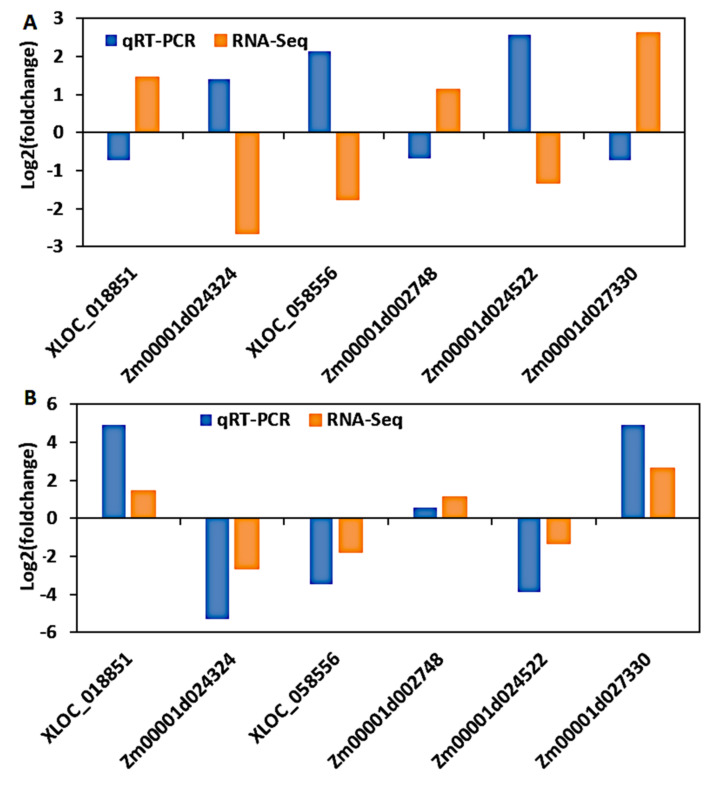
Figure 10.
Validation of RNA-Seq results by qRT-PCR. Each log2 fold change calculated from qRT-PCR was compared with the log2 fold change of the RNA-Seq data. (A) The inverse expression patterns of the RNA-Seq and qRT-PCR results from the cold-sensitive line (B73) is because the fold change ratio highlighted in this study emphasizes the expression pattern in cold-tolerant lines. However, if you take the inverse of that fold change ratio, which will highlight the expression pattern in cold-sensitive lines, then the RNA-Seq and qRT-PCR expression trends would be identical. (B) The cold-tolerant line’s (CIMBL116) RNA-Seq and qRT-PCR results show a similar expression trend. Orange and blue bars represent RNA-Seq and qRT-PCR data, respectively.

