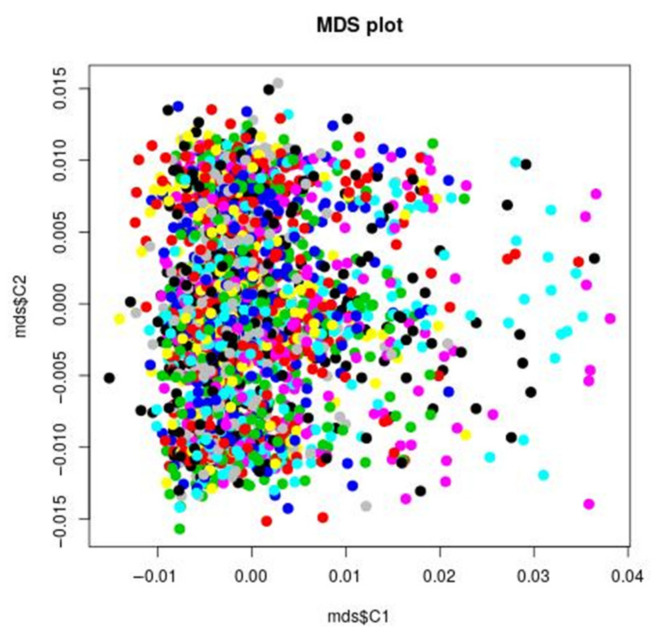
Figure 1.
MDS plot: IBS clustering analysis of the genetic stratification factors. Increasing values of the first component do not correspond to visual significant increasing or decreasing values of the second component, suggesting that the covariance between the two components in the genetic is minimal. For example, to small and increasing values of the first component correspond both small and higher values of the second component. The points are concentrated in the left end of the figure, indicating a larger variance of the first component. In order to further test this visual impression, the plink permutation test for between group IBS differences confirmed that there was no significant group genetic differences (stratification factors) with respect to all the phenotypes under analysis. That does not necessarily mean, that there is no genetic stratification in the STEP-BD sample, but that this stratification is not of main significant interest when considering the phenotypes under analysis. The pairwise clustering based on IBS (identity by state) is useful for detecting pairs of individuals who look more different from each other than what is expected in a random, homogeneous sample. This method allows for identification of clusters of patients, that are more genetically similar to each other than they are similar to the rest of the sample. Such groups are identified by different colors in the figure.

