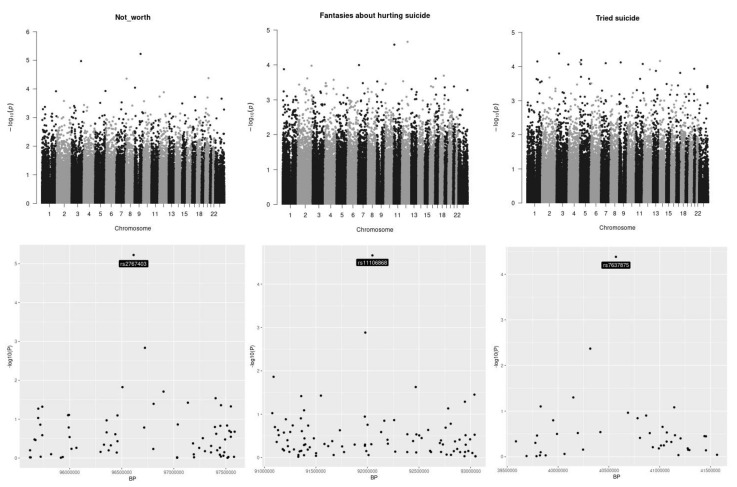
Figure 2.
Manhattan plots. Manhattan plots for the three outcomes under analysis are presented in the top of the picture. At the bottom of the picture the genomic areas with the strongest associations are shown. The outcomes under analysis are, respectively, from left to right, “having a feeling of not worth”, “fantasies about a hurting suicide” and “tried suicide”. None of the single investigated SNP reached the genome-wide threshold.

