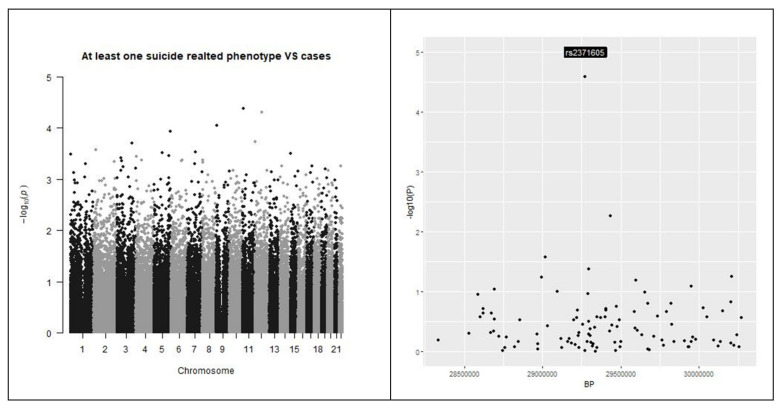
Figure 6.
Manhattan plots. Left: Manhattan plots for the outcome under analysis were reported. Right: the genomic areas with the strongest associations with outcome are shown. The outcome under analysis is suicidal behavior versus controls. None of the single investigated SNP reached the genome-wide threshold.

