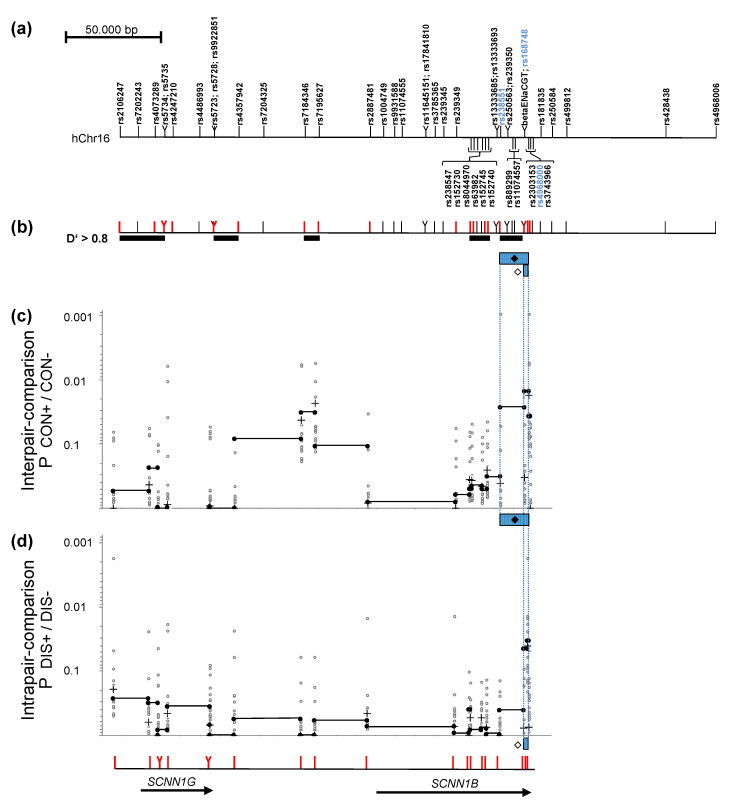
Figure 1.
Mapping of a regulatory element within SCNN1B using an association study in two non-overlapping sets of affected patent pairs (a) Genomic map of the SCNN1B/SCNN1C region analysed by 7 previously typed markers (Stanke et al., 2006) and 49 SNPs genotyped for fine-mapping. Markers rs238551, rs168748 and rs4968000 are highlighted in blue as they define the fragments of interest (see (c,d)). (b): Markers depicted in red are informative (MAF > 0.4) and were used to describe haplotype blocks (D’ > 0.8; black bars) and map association signals for interpair-comparison of concordant mildly (CON+) and concordant severely (CON−) affected patient pairs (c) and for intrapair comparison of mildly (DIS+) and severely (DIS−) affected siblings within discordant pairs (d). (c,d): Association signals comparing CF patients with contrasting phenotypes. p-values corrected for multiple testing of 20 informative markers were: Pcorr CON+/CON− = 0.0528 and Pcorr DIS+/DIS− = 0.05. Uncorrected raw P values are shown for single markers (+), 2-marker-haplotypes of adjacent informative markers (filled circles in all diagrams; genomic segments spanned by two adjacent markers are linked by a black line) and 2-marker-haplotypes of non-adjacent markers (open circles). (c): Interpair comparison of concordant sibling pairs: P values were computed comparing haplotype distributions of 11 concordant mildly affected patient pairs (CON+) and 10 concordant severely affected patient pairs (CON−). The fragment marked ♦ corresponds to rs238551 to rs4968000. (d): Intrapair comparison within discordant pairs. P values were computed comparing the mildly affected sibling (DIS+) to the severely affected sibling (DIS−) for 14 discordant pairs. The fragment marked ♢ corresponds to rs168748 to rs4968000.

