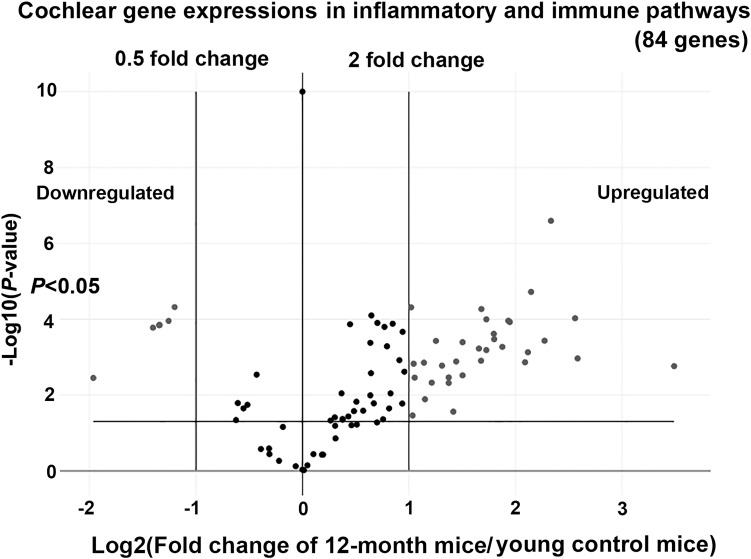
Fig 2. A volcano plot showing the ratios of the gene expression levels in the cochleae of 12-month-old mice relative to young control mice.
Data of 84 key genes involved in inflammatory and immune functions are plotted. Forty of the 84 genes are differentially expressed with greater than twofold upregulation (greater than a twofold change, 33 genes) or downregulation (less than a 0.5-fold change, 7 genes), as well as significant P-values to indicate differential expression levels (P<0.05, t-test) between the cochleae of 12-month-old vs. 6–7-week-old mice (young control mice). The x-axis indicates Log2 (fold change of 12-month-old mice/young control mice) showing the relative expression levels. The y-axis represents–Log10 (P-value) to assess significant differences between the two groups (n = 3 for each gene in the 12-month-old and young control mice).

