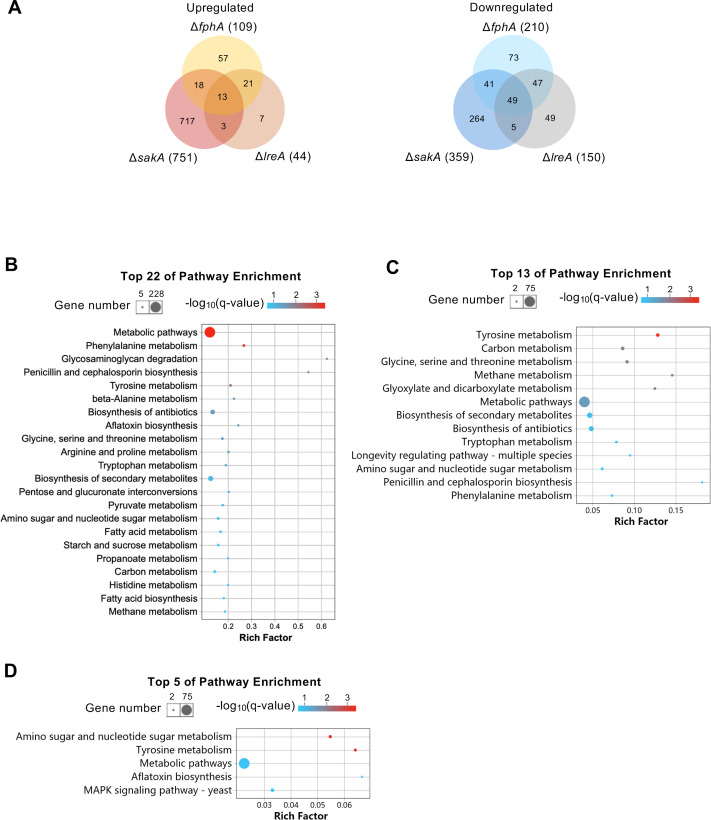
Fig 5. Venn diagram and KEGG pathway enrichment analyses of DEGs identified in the mutants in comparison to wild type in the dark.
Venn diagram analyses (A) performed with up- and downregulated genes in ΔsakA, ΔfphA, ΔlreA mutants. KEGG pathway analyses conducted with the DEGs identified in ΔsakA (B), ΔfphA (C), ΔlreA (D), respectively. The bubble charts were created with significantly enriched pathways (p-value ≤ 0.05). The color of the bubbles indicates the value of -log10(q-value) and the q-value represents corrected p-value. Rich factor refers to the quotient of the number of DEGs and the total gene amount in the pathway.

