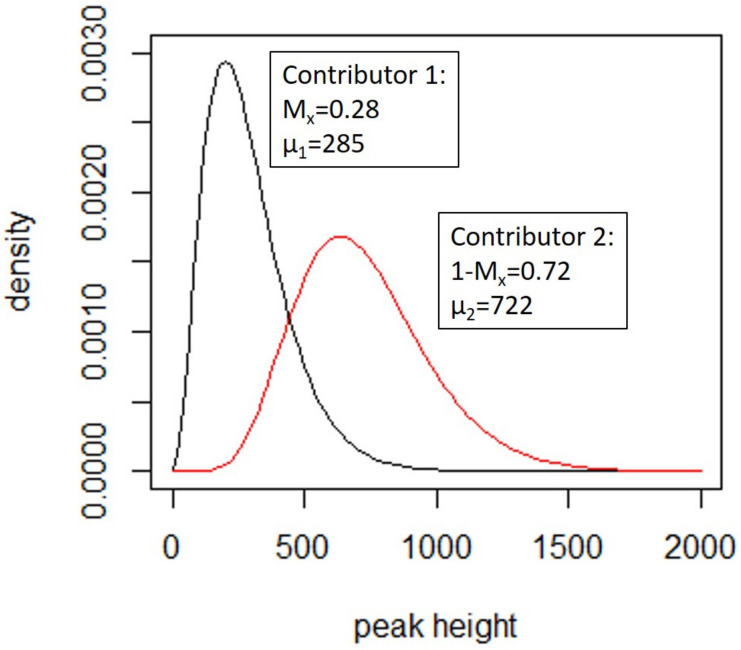
Figure 3.
γ distributions for a simple case, where shape parameters = 3.312 and 8.381, respectively and the scale parameter is 86.2. The peak height expectation (µ) and Mx are shown for each contributor. The probability density function for the individual peak height contributions are derived from these curves. Reprinted from [62], chapter 7, Copyright (2020) with permission from Elsevier.

