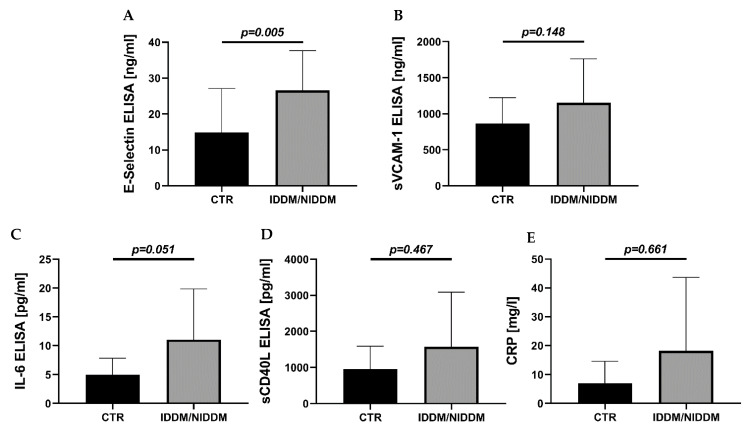
Figure 3.
Serum markers of inflammation. (A) Significant raise of E-selectin in the diabetic (IDDM/NIDDM) versus the control (CTR) group. (B) Enhanced concentration of VCAM-1 in the IDDM/NIDDM versus CTR group (n.s). (C) Increased concentration of interleukin-6 (IL-6) in the IDM/NIDDM versus CTR group (n.s.). (D) Increase in concentration of CD40L and (E) C-reactive protein (CRP) in the DM versus CTR group (n.s.). Data are mean ± SD of n = 15 (CTR) and 11 (IDDM/NIDDM) patients (A–D) or n = 11–12 (E). Mann–Whitney test in (A,D,E) and unpaired t test in (B,C). CTR, control; IDDM, insulin-dependent diabetes mellitus type 2; NIDDM, non-insulin-dependent diabetes mellitus type 2.

