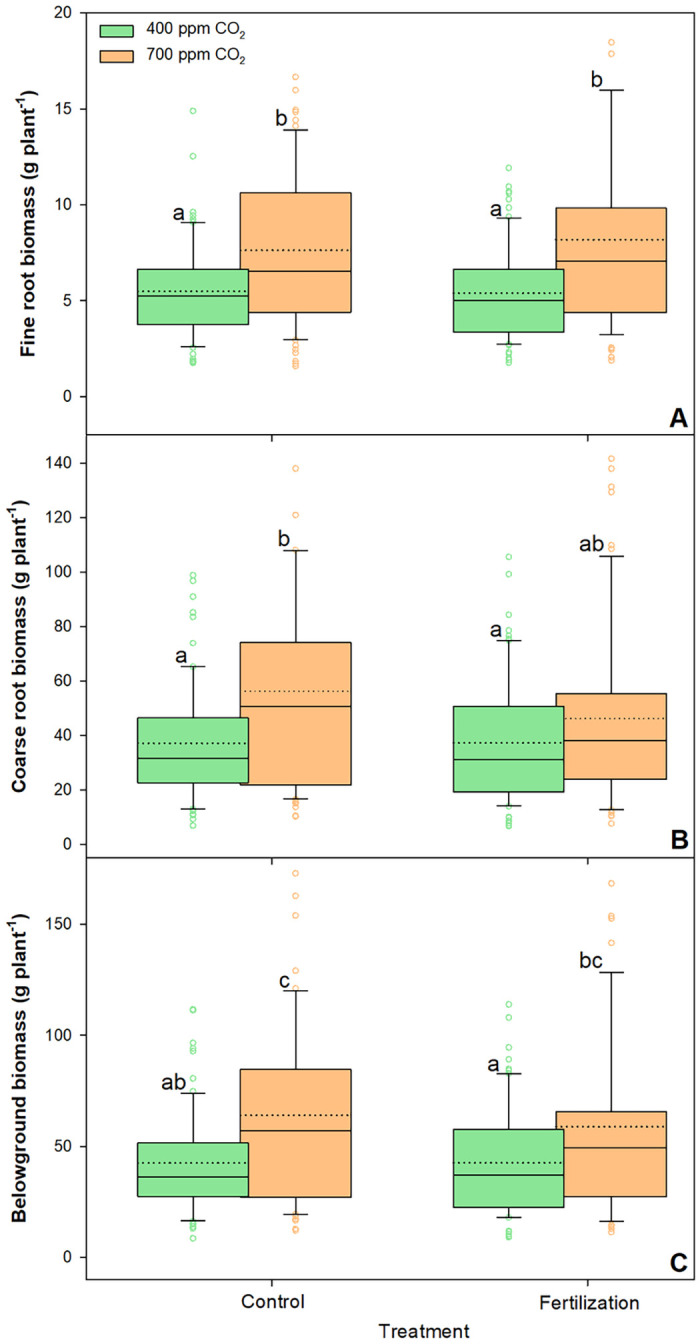
Fig 3. Changes in fine roots biomass (A), coarse roots biomass (B), and belowground biomass (C) of sessile oak saplings (n = 72) treated under ambient (400 ppm CO2) and elevated (700 ppm CO2) and different nutrient supplies.

The data are expressed as medians (solid lines) and means (dotted lines) of measurements. The box boundaries mark the 25th and 75th percentiles and whiskers the 10th and 90th percentiles. Circles mark outliners. Different letters indicate significant differences (p ≤ 0.05) estimated on the basis of Duncan’s ANOVA post-hoc test.
