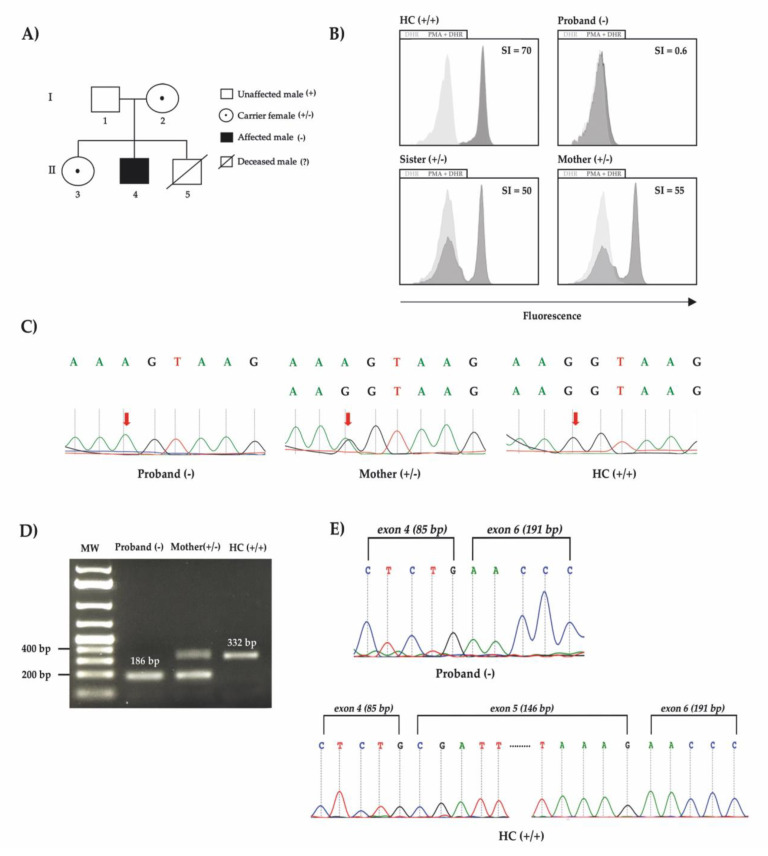
Figure 1.
(A) The proband’s family pedigree of affected patients displaying two generations. White circles with central dots represent carriers, the proband is represented as a black square. (B) Flow cytometry was used to assess fluorescence intensity increase after neutrophils stimulation with PMA in presence of DHR123 (grey histogram) and control with DHR only (faint histogram). In the healthy control, the curve shifts to the right, showing a neutrophil’s response. The proband’s curves before and after stimulation overlap, showing that there was no phagocyte respiratory burst. The curves of the proband’s mother and sister partially shift, revealing their carrier state, seeing as, because of their heterozygous variant, part of their neutrophils responds but the rest does not. SI = stimulation index. (C) Electropherogram from DNA showing homozygous variant on the proband, heterozygous variant on the proband’s mother, a mutation carrier, and homozygous wild type allele in a healthy control. (D) cDNA PCR products confirming a small fragment from the proband compatible with exon 5 skipping in comparison to a healthy control (HC) on agarose gel. Healthy control (HC), proband’s mother and sister were positive, while the proband was negative, suggesting intronic retention. MW: molecular weight. (E) Electropherogram from cDNA showing exon 5 skipping on the proband and continuous exon 4 to 6 in a healthy control (HC).

