Figure 2.
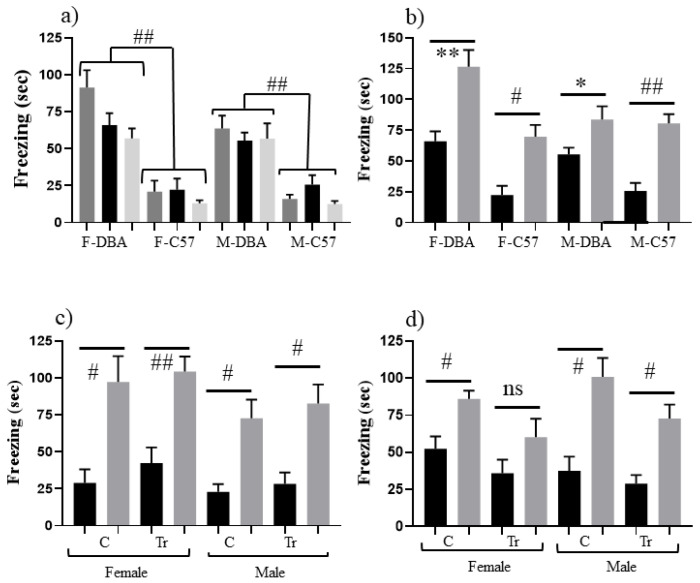
Effect of DBA/2J genomic background on CFC performance of 3 month old mice. (a) Freezing (seconds) during 3 min of SC training (SC, black bars), SC testing (SC-t, light grey bars) and CS training (CS, dark grey bars) of female (F) and male (M) control mice on the DBA/2J (DBA) and C57bL6/J (C57) genomic backgrounds. Freezing of DBA mice in all three measures is significantly higher than freezing in C57. (b) Freezing (seconds) during 3 min of shock-context test (SC-t, black bars) and context-shock test (CS-t, grey bars) for control mice on the DBA and C57 genomic backgrounds. Difference between CS-t and SC-t within sex and background. (c) Freezing (seconds) during 3 min of shock-context test (SC-t, black bars) and context-shock test (CS-t, grey bars) of F1 mice from crossing trisomic male Dp17 on the C57 background with female controls on the DBA background. C, control; Tr, trisomic. Difference between CS-t and SC-t within sex and DS line. (d) Freezing (seconds) during 3 min of shock-context test and context-shock test (CS-t, grey bars) of F1 mice from crossing trisomic male Dp10 on the C57 background with female controls on the DBA background. Difference between CS-t and SC-t within sex and DS line. * p < 0.05–0.01; ** p < 0.01–0.001; # p < 0.001–0.0001; ## p < 0.0001; ns, not significant. Error bars represent the SEM. Number of animals in SC and CS, respectively (from Table 1): (b) F-DBA, 8,9; F-C57, 11,13; M-DBA, 11,11; M-C57, 11,12; (c) FC, 7,7; FTr, 10,10; MC, 6.9; MTr, 7,9; (d) FC, 15,16; FTr, 9,9; MC, 9,9; MTr, 9,8.

