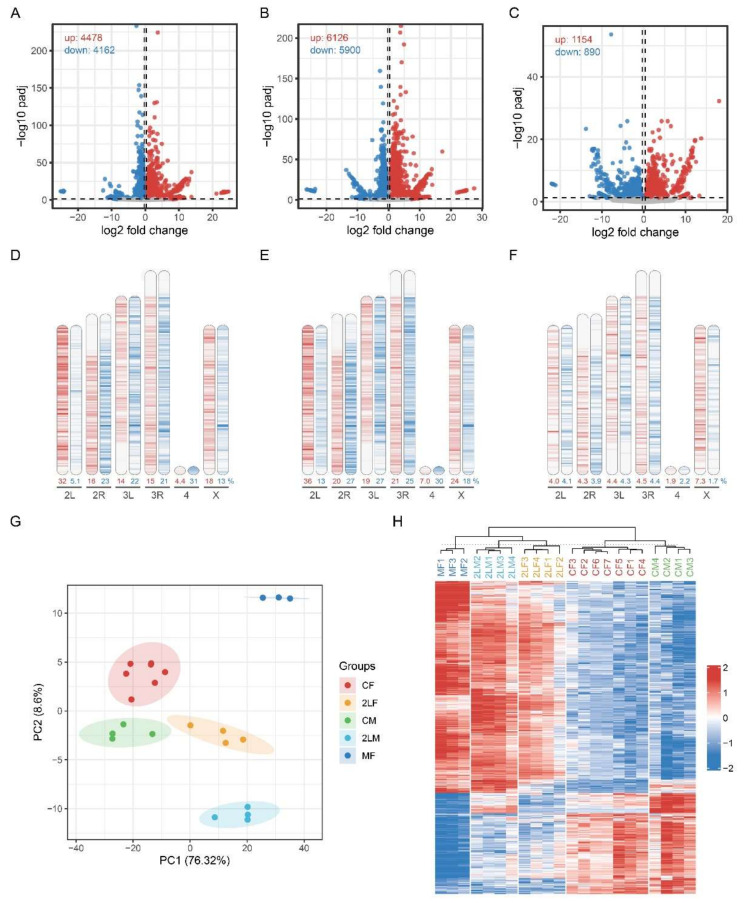
Figure 1.
Overview of the differentially expressed genes (DEGs) in three kinds of aneuploidy. (A–C) Volcano plots of DEGs in trisomy 2L female (A), trisomy 2L male (B) and metafemale (C) compared with normal diploid of the corresponding sex. DEGs are defined as adjusted p-value < 0.05 and fold change >1.25 or <0.8. (D–F) Density heatmaps of the distribution of DEGs along Drosophila chromosomes in trisomy 2L female (D), trisomy 2L male (E) and metafemale (F). The red bands represent up-regulated genes, and the blue bands represent down-regulated genes. The darker colors show a greater density of DEGs. The number below the chromosomes indicates the percentage of up- or down-regulated genes in the total number of genes in this chromosome. (G) Principal component analysis (PCA) plot of all aneuploidy samples and control groups. The circles represent 95% confidence intervals. (H) Heatmap of all aneuploidy samples and control groups. CF, wildtype female control; CM, wildtype male control; 2LF, trisomy 2L female; 2LM, trisomy 2L male; MF, metafemale.

