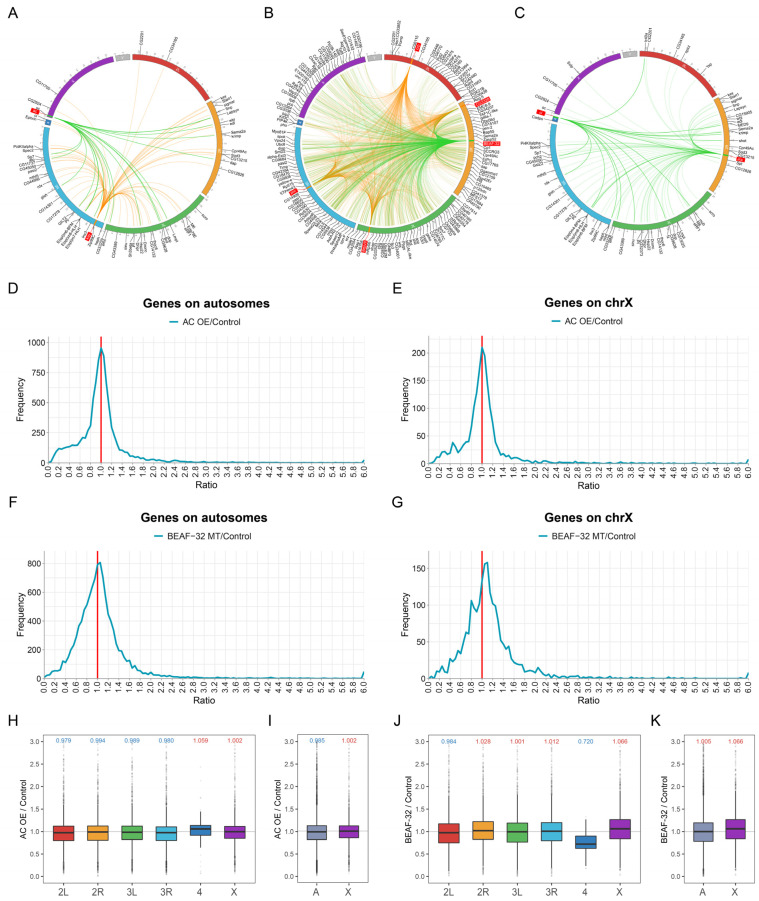
Figure 4.
Modulation of gene expression by candidate transcription factors. (A–C) The circular plots show the target gene networks of candidate TFs in all trisomies (A), trisomy 2L females and males (B) and trisomy females (C). The green lines indicate that the expression of this TF is down-regulated in trisomies, and the yellow lines indicate that the expression of this TF is up-regulated in trisomies. Candidate TFs are labeled with red rectangles. Target genes are partially listed on the periphery of the chromosomes. (D,E) Ratio distributions of gene expression in TF ac overexpression Drosophila compared with control group. (F,G) Ratio distributions in TF BEAF-32 mutation Drosophila compared with control group. Genes are divided into autosomes (D,F) and X chromosome (E,G) according to their positions. The X-axis indicates the ratio of expression, and the Y-axis indicates the frequency of the ratios that fall into each bin of 0.05. The red solid line represents the ratio of 1.00 which means no change in gene expression. (H,I) Boxplots of ratios in ac overexpression Drosophila compared with control group. Genes are divided into each chromosome (H) or autosome and sex chromosome (I) according to their positions. (J,K) Boxplots of ratios in BEAF-32 mutation Drosophila compared with control group. Genes are divided into each chromosome (J) or autosome and sex chromosome (K) according to their positions. The gray solid line represents the ratio of 1.00 which means no change in gene expression. The numbers at the top of the boxplots indicate the median, blue represents down-regulation and red represents up-regulation.

