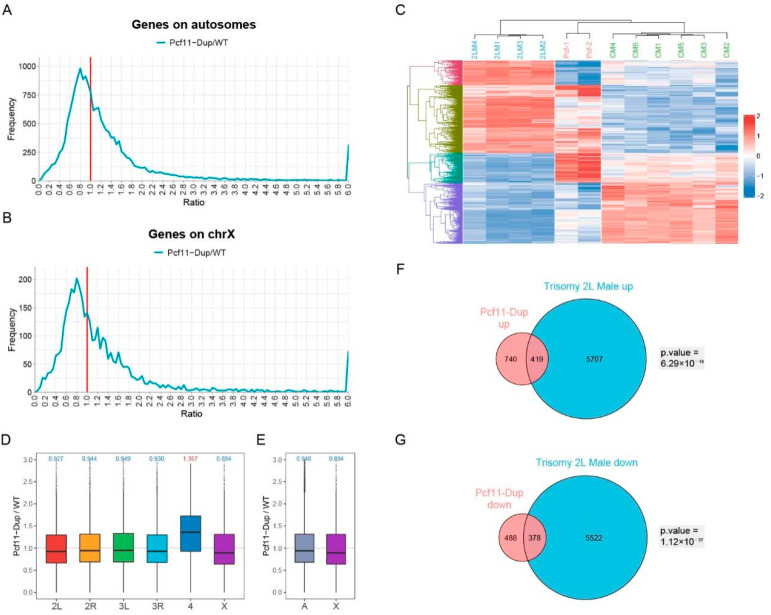
Figure 5.
Effect of inverse regulator Inr-a/pcf11 on global gene expression. (A,B) Ratio distributions of Inr-a duplication male compared with wildtype male. Genes are divided into autosomes (A) and X chromosome (B) according to their positions. The X-axis indicates the ratio of expression, and the Y-axis indicates the frequency of the ratios that fall into each bin of 0.05. The red solid line represents the ratio of 1.00 which means no change in gene expression. (C) Heatmap of common differentially expressed genes in Inr-a duplication male and trisomy 2L male compared with wildtype male. CM, wildtype male control; 2LM, trisomy 2L male; Pcf, Inr-a duplication male. (D,E) Boxplots of ratios in Inr-a duplication male compared with wildtype male. Genes are divided into each chromosome (D) or autosome and sex chromosome (E) according to their positions. The numbers at the top of the boxplots indicate the median, blue represents down-regulation and red represents up-regulation. (F,G) Venn diagrams show the number of up-regulated (F) or down-regulated (G) genes in Inr-a duplication male and trisomy 2L male. DEGs are defined as adjusted p-value < 0.05 and fold change >1.25 or <0.8 in trisomy 2L male, and adjusted p-value < 0.05 in Inr-a duplication male. Fisher’s exact test p values are shown beside the Venn diagrams.

