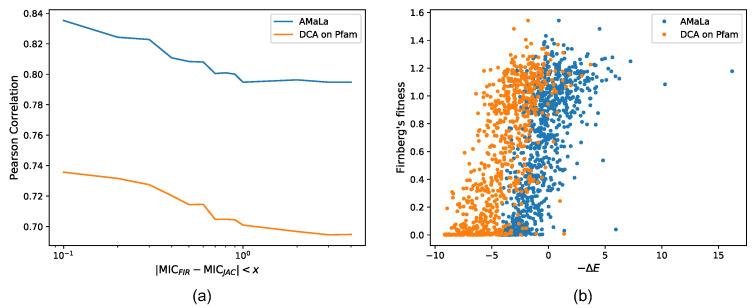
Figure 1.
Correlation between inferred energies and fitness measurements realized in [7]. Such measurements are preliminarily mapped over [4] data following the same procedure proposed in [32]. As a consequence of this mapping, the overlap of the sequences appearing in both [26] and the testing dataset amounts to just two. Furthermore, it is also possible to filter out the noisiest data, retaining only those measurements displaying a low discrepancy between the two datasets. Panel (a) shows the trend of the Pearson correlation obtained as a function of this discrepancy threshold. Namely, correlations are referred to as energies inferred over Fantini’s dataset [26] via AMaLa (blue line) and over PFAM PF13354 via PlmDCA (orange). More specifically, such energies are previously mapped over fitness scores via the same procedure exploited to map [7] into [4]. This strategy allows expressing the correlation performance in terms of a linear estimator rather than the more general Spearman coefficient. From the plot, it emerges how correlations increase by progressively excluding those measurements with the highest discrepancy among the datasets. Moreover, [26] measurements analyzed via AMaLa turn out to provide a better fitness estimator with respect to the homology family, characterized by a much more dispersed distribution of sequences. In panel (b), the scatter between the minus energies (not mapped) and the fitness measurements of [7] is reported, with a discrepancy threshold between minimum inhibitory concentrations equal to .

