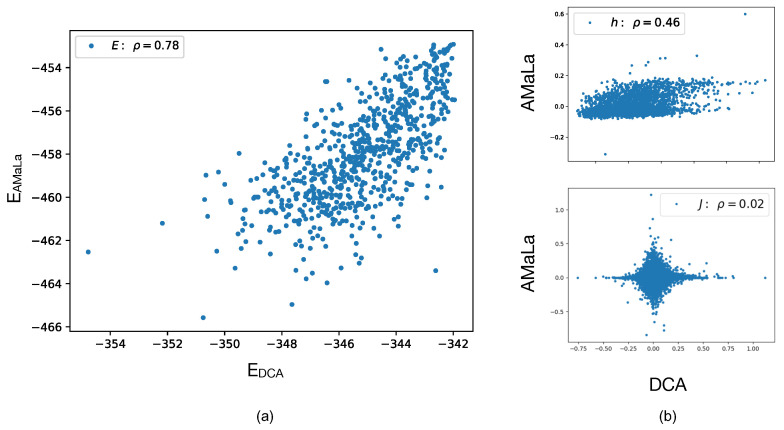
Figure 2.
Model comparison between standard PlmDCA performed over the homology family (PF13354) and AMaLa inferred over [26] data restricted to residues corresponding to the homologues alignment. Panel (a) shows the scatter between the resulting total energies. Panel (b) displays the scatter plots of individual parameters. In the upper plot, the scatter among single-site fields is reported, and in the lower one, among pair interaction coupling . Even if energetic parameters display separately either low () or no correlation at all (), the resulting energies are nonetheless significantly correlated, the Pearson coefficient being . This underlines how the quantity encoding the relevant phenotypic information is indeed the total energy.

