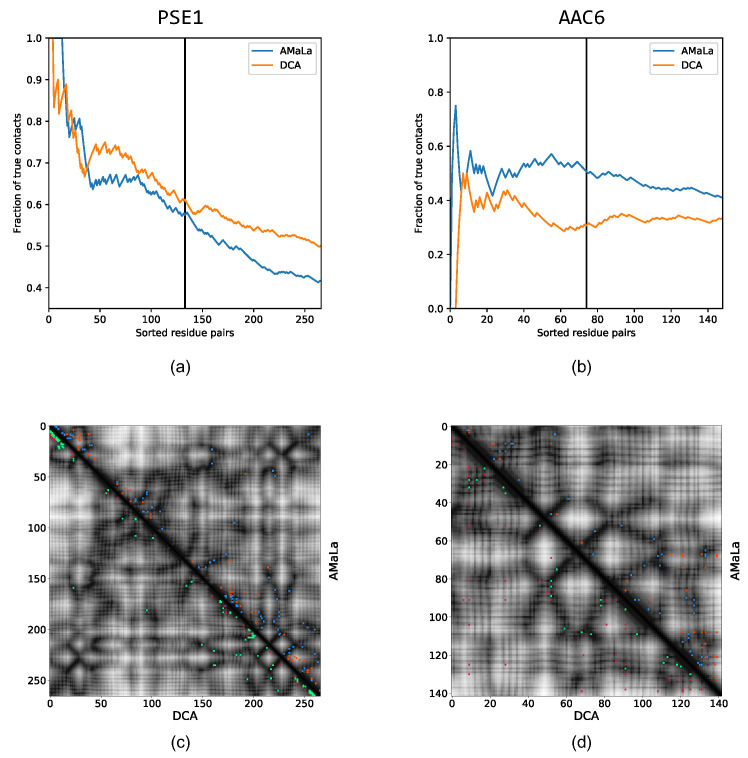
Figure 3.
Top: sensitivity plot for contact prediction via parameters inferred on PSE-1 and AAC6 [29] datasets. Blue curve: the score is computed as the Frobenius norm of the couplings inferred with the AMaLa method. Orange curve: the score is computed as the Frobenius norm of the couplings inferred with the standard pseudo-likelihood maximization approach. In panel (a), we have the result for PSE-1. At the -th ranked residue pair, AMaLa provides AUC, PPV, whereas PlmDCA yields AUC, PPV. Panel (b) shows the sensitivity plot for AAC6. In this case, AMaLa yields at half of the length AUC, PPV, whereas for PlmDCA, we have AUC, PPV. Bottom: contact maps up to predictions. In the upper-right half, the results related to AMaLa are reported, whereas in the lower-left, the prediction provided by PlmDCA is reported. Correctly predicted contacts are colored in green/blue, while wrong prediction are reported in red/orange for PlmDCA/AMaLa, respectively. Panel (c) reports the result for PSE-1. Even if DCA provides both higher AUC and PPV, AMaLa seems to predict more long range contacts. A similar outcome, although less pronounced, can be appreciated in panel (d), which shows the contact map related to AAC6.

