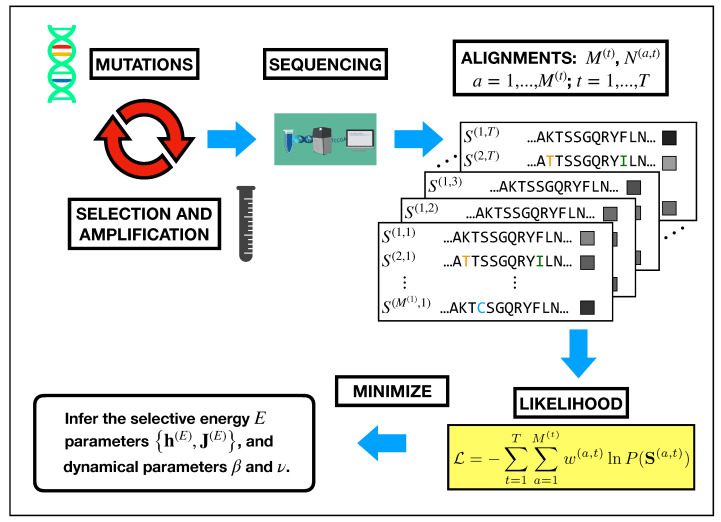
Figure 6.
Pictorial representation of data generation in a Directed Evolution experiment and how they are plugged into the likelihood function to perform the inference. The sequencing of repeated rounds of mutation and selection generates a set of multiple sequence alignments. There, we highlighted with colored letters the sites that have been mutated with respect to the wild-type, coinciding with the first row of the alignment. Moreover, at the right of the sequences, boxes in gray-scale represents the abundances (increasing from black to white). Each sample of sequences and the related abundances for are used to define the likelihood function, which subsequently depends only on the parameters to be inferred: (see Equations (1)–(3) and (7)). The inference of these parameters is based on the maximization of the log-likelihood. In order to determine the parameters and , the maximization problem over the energetic parameters is repeated, performing a scan over a set of possible values. Then the pair corresponding to the global maximum of the minus log-likelihood is retained.

