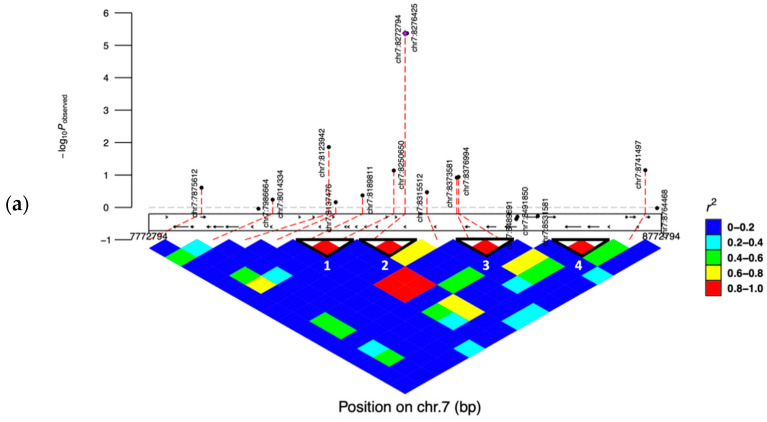
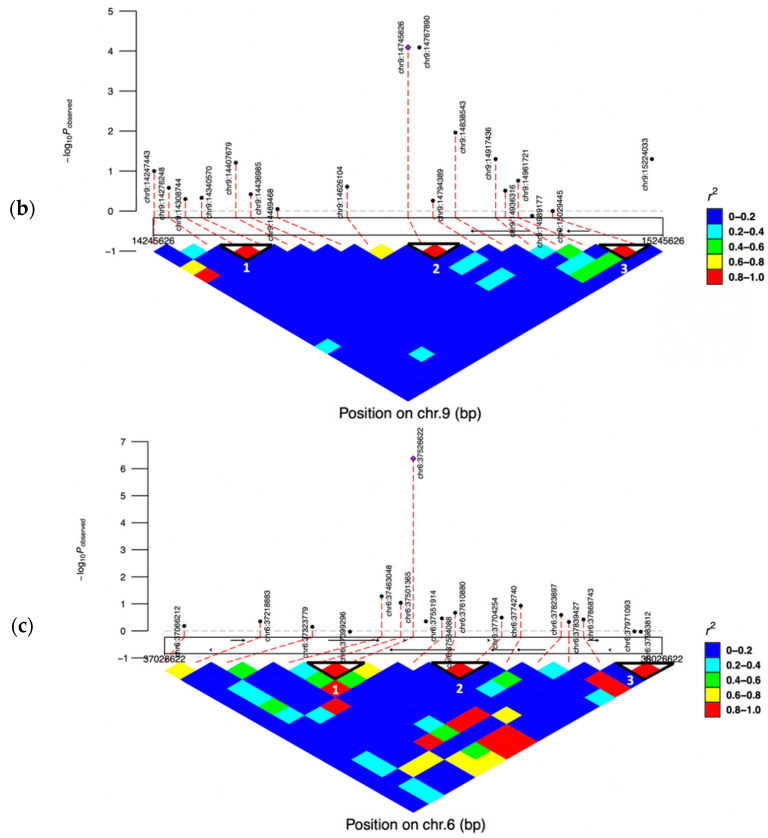
Figure 3.
Linkage disequilibrium (LD) analysis. Solid line triangles refer to blocks of high linkage disequilibrium. The color of one square refers to the LD level (r2) between two SNPs. (a) LD pattern for 17 SNPs in the region between 7,772,794 to 8,772,794 Bp on chromosome 7; (b) LD pattern for 20 SNPs in the region between 14,245,626 to 15,245,626 Bp on chromosome 9; (c) LD pattern for 17 SNPs in the region between 37,026,622 to 38,026,622 Bp on chromosome 6.


