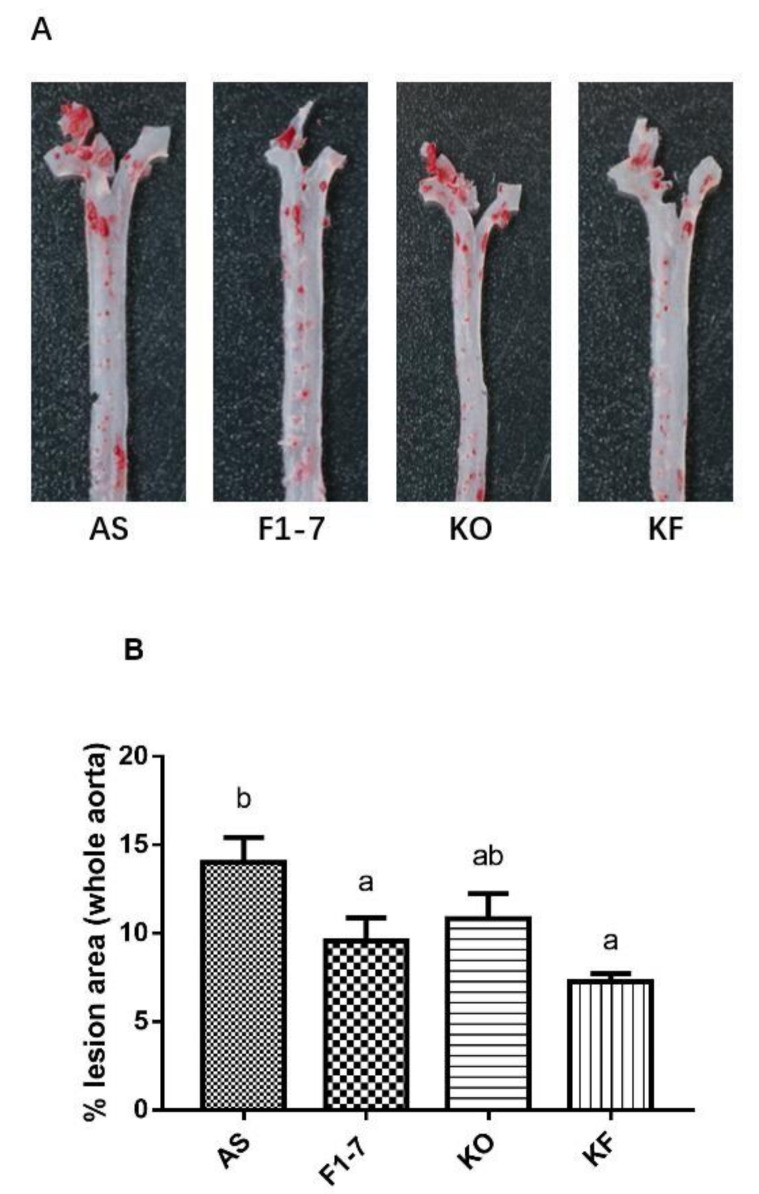
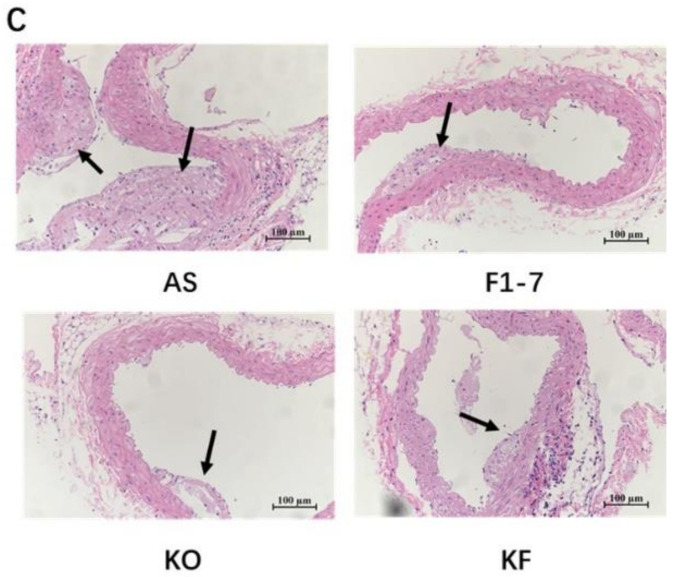
Figure 1.
(A) Representative images of the aorta Oil Red O staining plaque burden (n = 4). (B) The quantification of lesion in percentage area was analyzed by Image J software. Different letters indicate significant differences from each group, p < 0.05. (C) H&E staining of the aorta section (n = 3). The arrow points to the plaque of the aorta.


