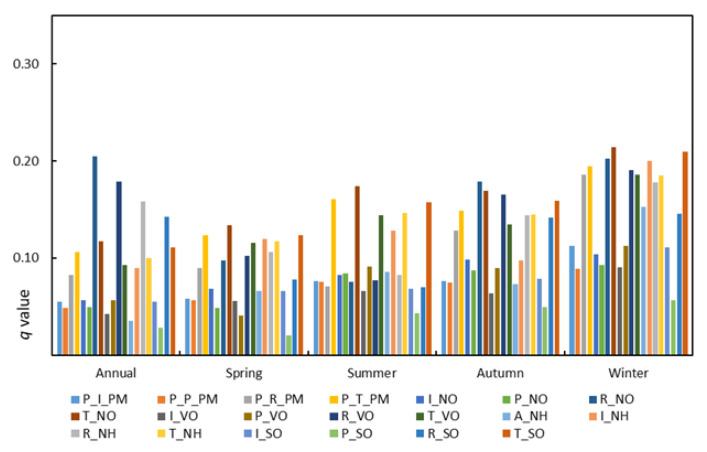
Figure 2.
The q value of the driving factor on the national annual and seasonal scales. (P_I_PM denotes primary industry PM2.5; P_P_PM denotes primary power PM2.5; P_R_PM denotes primary residential PM2.5; P_T_PM denotes primary transportation PM2.5; I_NO denotes industrial NOX; P_NO denotes power NOX; R_NO denotes residential NOX; T_NO denotes transportation NOX; I_VO denotes industry VOCS; P_VO denotes power VOCS; R_VO denotes residential VOCS; T_VO denotes transportation VOCS; A_NH denotes agricultural NH3; I_NH denotes industrial NH3; R_NH denotes residential NH3; T_NH denotes transportation NH3; I_SO denotes industrial SO2; and P_SO denotes power SO2).

