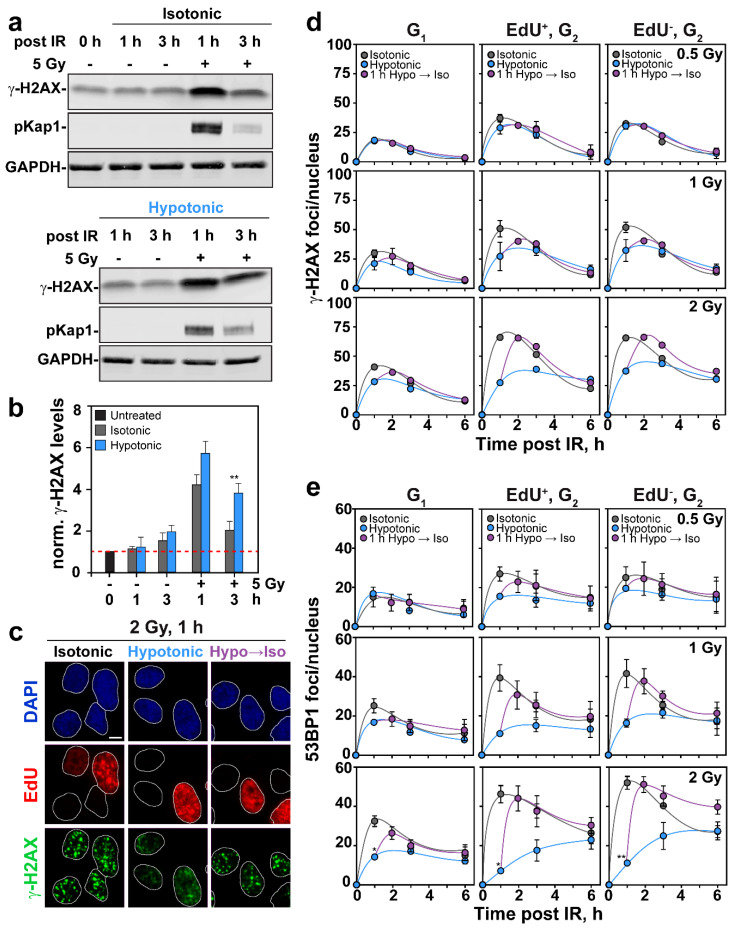
Figure 4.
HypoS suppresses formation of γ-H2AX and 53BP1 foci in an IR-dose and cell cycle phase-dependent manner. (a) Western blot analysis of γ-H2AX and pKap1 in extracts of RPE cells as a function of time after exposure to HypoS and 5 Gy. GAPDH served as loading control. (b) Densitometric analysis of γ-H2AX band intensity in a. Plotted is protein level normalized to loading control. Means ± SE from two independent experiments are shown. (c) Representative images of DAPI-stained RPE nuclei showing EdU incorporation and γ-H2AX foci formation after 1 h of HypoS and 2 Gy. Images of cells transiently (1 h) exposed to hypotonic medium are also shown. Scale bar: 5 µm. (d) QIBC analysis of γ-H2AX foci formation after background (nonirradiated) subtraction in G1-phase cells, EdU+, G2-phase cells and EdU−, G2-phase cells maintained in isotonic (grey symbols) or hypotonic medium (blue symbols) after exposure to the indicated IR doses. Violet symbols show kinetics of foci formation in cells that were treated hypotonically post IR for 1 h and then transferred to isotonic medium. Data represents means ± SE from two experiments (except for 2 Gy where n = 1). Error bars are visible when larger than the symbols used. (e) As in (d) for 53BP1. Differences reaching statistical significance between isotonic and hypotonic treated cells are marked with * p < 0.05 and ** p < 0.01.

