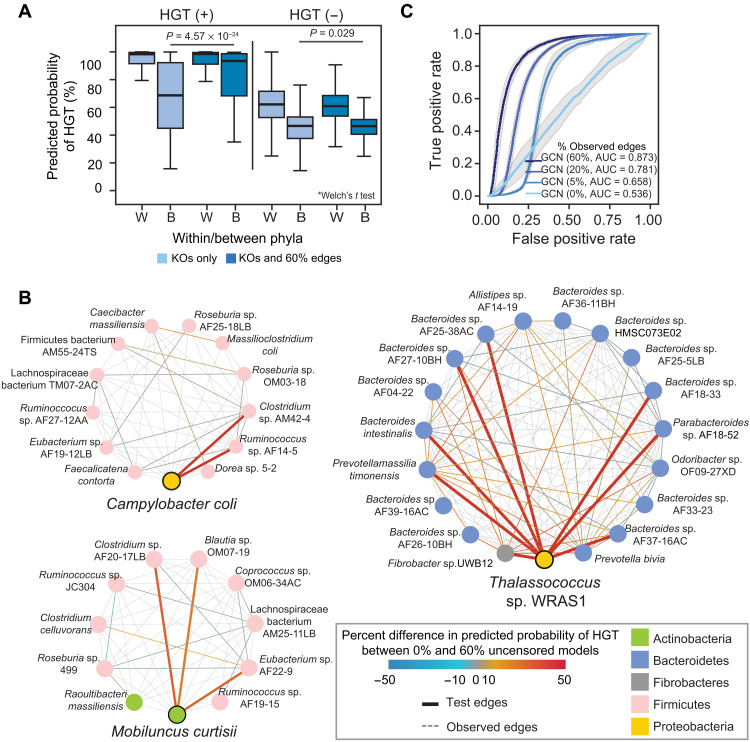
Fig. 2. Network topology is sufficient for predicting HGT.
(A) Predicted values for the GCN used in Fig. 1D of HGT-positive and HGT-negative edges for those involving species from the same phylum (within) or different phylum (between) when predicting on a test set with fully censored or 60% uncensored edges. The middle of the boxplot is the median, and edges are quartiles. P values are provided for the differences between predicted values for interphyla HGT-positive and HGT-negative edges using a Welch’s t test. (B) Three examples of the HGT-positive connections between organisms in the test sets used in the GCNs shown in Fig. 1D. In each, a single organism (Campylobacter coli, Mobiluncus curtisii, or Thalassococcus sp. WRAS1) is depicted with all of HGT-positive connections within the network. Test edges corresponding to interphylum transfers involving these species are thickened. Edges are either colored according to the difference in the HGT prediction in the fully censored and 60% uncensored networks or are dotted, gray edges, representing positive HGT edges that were uncensored in the test data. Genomes (nodes) are colored according to phylum. (C) ROC curves for GCN models using only the adjacency matrix for predictions, with 0, 5, 20, or 60% of the edges uncensored in the test set. These iterations were performed on the same training and test sets as in Fig. 1D. AUC values are shown.

