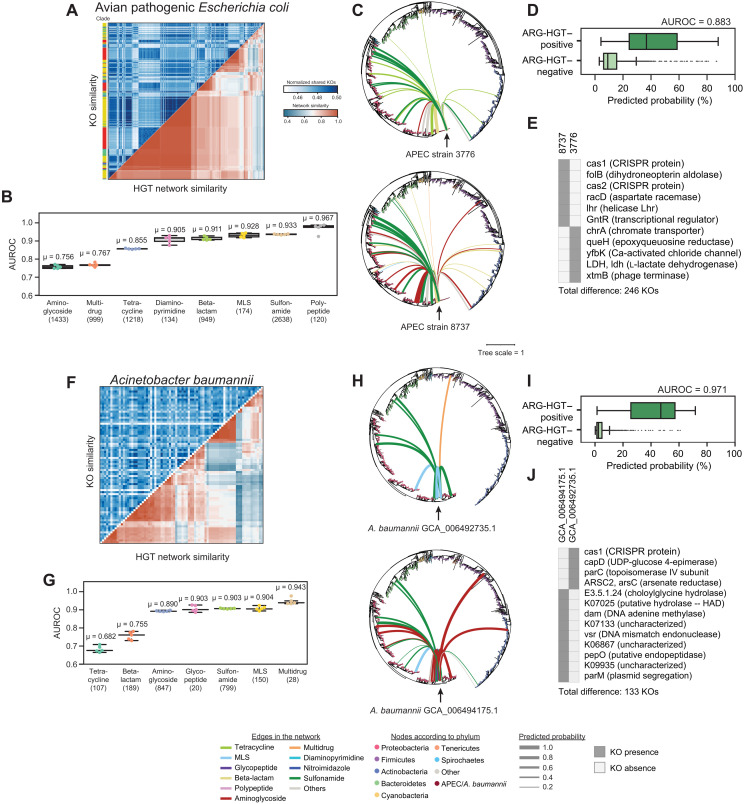
Fig. 4. HGT is predictable across pathogenic strains of the same species.
(A) A heatmap showing normalized shared KOs for 445 avian pathogenic E. coli (APEC) isolates (top left) and their ARG-specific HGT network Jaccard similarity. Isolates are clustered according to HGT network similarity. The phylogenetic clade for each isolate is plotted adjacent to the heatmap. (B) Area under the ROC curves are plotted for the ARG classes for the APEC isolates for five RF models using the same dataset as Fig. 1, excluding E. coli and/or any organisms with 97% similarity to the 16S rRNA of any genome in the test set. Mean AUCs are provided above the boxplots. Boxplots represent median and quartile values. The number of edges containing at least one class-specific ARG is noted below the ARG class names. (C) The ARG-specific HGT network of two APEC isolates. The phylogenetic tree of all isolates includes 12,518 genomes from the original network, and 445 APEC isolates is shown with edges corresponding to predicted HGT events involving ARGs. The color of each edge corresponds to the ARG class, whereas the thickness of each edge is relative to the probability of ARG-HGT. (D) The distribution of ARG-HGT probabilities from the ARG-HGT RF model for ARG-HGT–positive (top) and ARG-HGT–negative (bottom) edges is shown. The AUROC is provided. (E) Important KOs that distinguish the two APEC strains in (C) are shown. (F to J) Same as (A) to (E) but for 96 clinically relevant Acinetobacter baumannii isolates.

