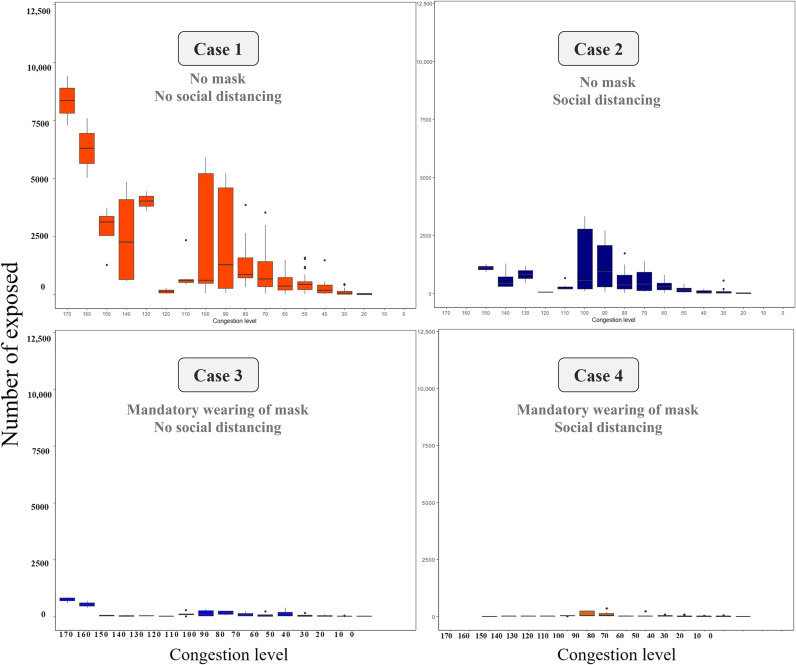
Fig. 4. Trend of exposed agents based on the degree of congestion in each case.
The graphs show the number of exposed agents based on different congestion levels for each case. First, the probability per person is not absolute and every individual agent’s probability of exposure varies depending on the actual probability of contact with the infected person, the congestion level in the public vehicle, and contact. The analysis calculated the probability of exposure for each individual agent over 1 day. The figure shows the average value generated by individual agents for each congestion level. The individual agent values cannot be presented because approximately 10 million journeys are made on the Seoul public transportation system per day. The average value is therefore calculated as the probability of exposure given the number of people exposed at different congestion levels. The standard deviations are also presented in the graph. In the case with social distancing (case 2), the upper limit of congestion is limited. Hence, the number of exposed agents decreases. When masks are worn (cases 3 and 4), the agent is less likely to be exposed (see Supplementary Materials, section 4.2).

