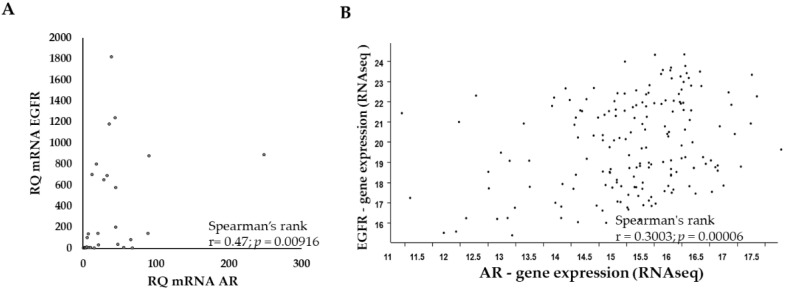
Figure 1.
AR and EGFR expression levels are highly correlated in glioblastoma. (A) Spearman correlation analysis of qPCR results of AR versus EGFR mRNA expression following normalization to HPRT in 28 glioblastoma tumor samples. Y-axis, relative quantification (RQ) of EGFR; X-axis, the RQ of AR. (B) Spearman correlation analysis of AR and EGFR RNA sequencing (RNA-seq) results from glioblastoma samples (n = 671) of the National Cancer Institute Genomic Data Commons TCGA following normalization by log2 [fragment per kilobase per million reads map (fpkm-uq + 1)]. Each dot on the graph represents one tumor sample.

