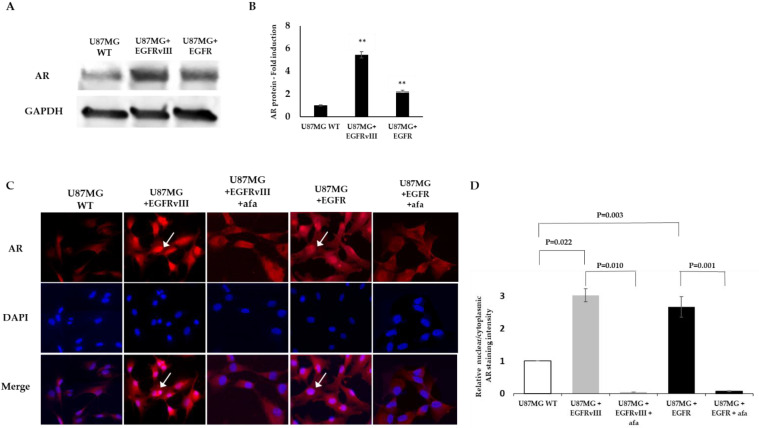
Figure 2.
EGFR promotes AR overexpression in the U87MG glioblastoma cell line model. (A) Western blot analysis using anti-AR (D6F11) in U87MG WT, U87MG EGFR, and U87MG EGFRvIII cells (upper gel). The anti-GAPDH housekeeping protein was used as a loading control (lower gel). (B) Androgen receptor protein level in U87MG WT, U87MG EGFR, and U87MG EGFRvIII cells (x-axis) was analyzed by PathScan ® Total Androgen Receptor Sandwich ELISA Kit. AR fold induction compared to U87MG WT is represented (Y-axis). The experiments were repeated three times. The results of the relative fold induction are presented as the mean ± SD. ** p < 0.01 versus the U87MG control group. (C) Immunofluorescence staining for anti-AR (D6F11) (red) in vehicle and afatinib-treated U87MG WT, EGFR, or EGFRvIII cells. Cell nuclei were stained with DAPI (blue). White arrows indicate AR nuclear staining. (D) Relative AR nuclear localization was determined by quantification of the relative fluorescent intensity ratio between nuclear and cytosolic compartments using ImageJ software. The results are expressed as mean ± SD following normalization to U87MG WT; p-values between the groups are indicated.

