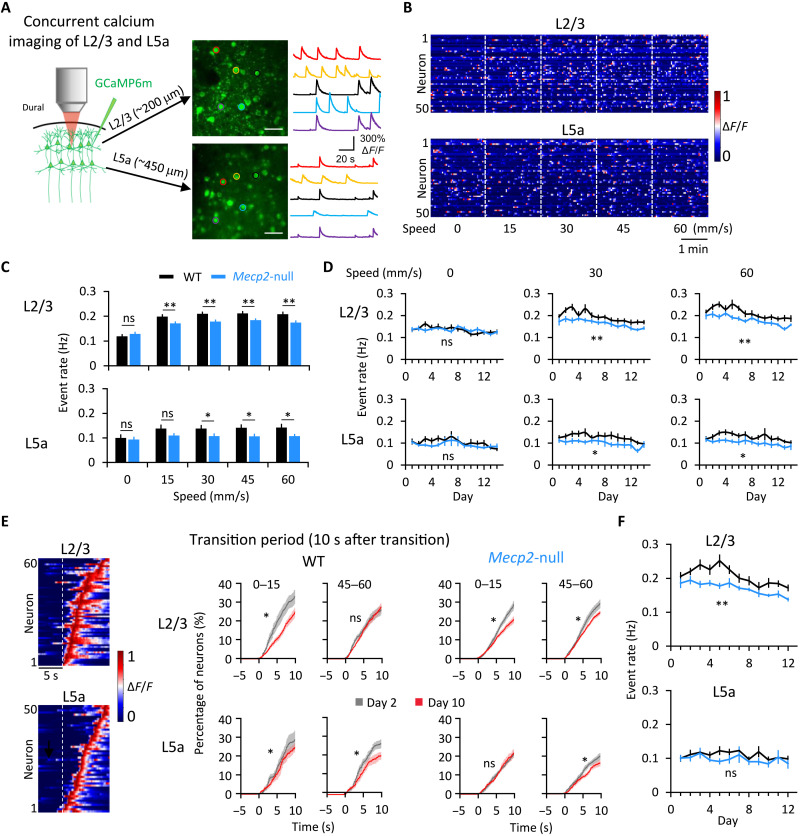
Fig. 2. Motor learning streamlines distribution of event rates in L2/3 and L5a.
(A) Images of pyramidal neurons expressing GCaMP6m in L2/3 (top) and L5a (bottom) of one mouse. The color of the circle around a given neuron in the photo matches the color of its activity trace. Scale bar, 50 μm. (B) Heatmap of neuronal activity from 50 representative neurons (rows) during increasing-speed mode. Colors represent normalization to the highest fluorescent intensity change (ΔF/F) of each neuron. (C) Averaged event rates of the detected neurons at five speeds. *P < 0.05 and **P < 0.01, RM-ANOVA test. (D) Averaged event rates across training days. L2/3 WT: n = 13; L2/3 Mecp2-null: n = 14; L5a WT: n = 11; L5a Mecp2-null: n = 13. *P < 0.05 and **P < 0.01, RM-ANOVA test. (E) Left: Heatmap of neuronal activity around a speed transition from 0 to 15 mm/s from one WT mouse. Right: Cumulative proportion of transition-associated neurons from all mice, on days 2 and 10, sorted by the peak of their response during 10 s after the transition from 0 to 15 and 45 to 60 mm/s. *P < 0.0001, Kolmogorov-Smirnov test. (F) Averaged event rate of neurons during 10 s after five speed-increasing transitions on each day of training. L2/3 WT: n = 11; L2/3 Mecp2-null: n = 12; L5a WT: n = 8; L5a Mecp2-null: n = 10. RM-ANOVA test. Error bars represent means ± SE. **P < 0.01.

