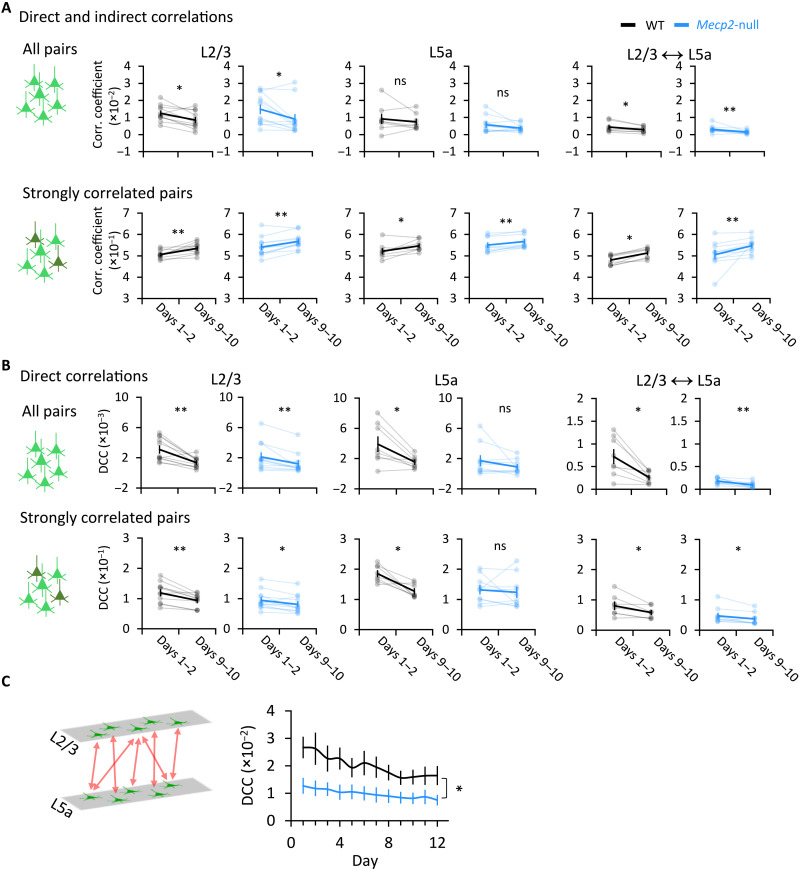
Fig. 3. Overall functional connectivity across M1 decreases with learning, but a small percentage of neuronal pairs become more strongly correlated.
(A and B) Mean direct and indirect correlation coefficients calculated as Pearson correlation coefficients (A) and direct correlation coefficient (DCC) calculated using direct correlation analysis (DCA) (B) between pairs of neurons within L2/3, within L5a, and across both layers during four running blocks for an individual WT or Mecp2-null mouse (top: all pairs of correlation; bottom: strong correlations, defined by a correlation coefficient that was greater than twice the SD). Light lines connect data from each individual mouse; dark lines connect the averaged data from all mice. L2/3 WT, n = 11 mice; L2/3 Mecp2-null, n = 12 mice; L5a WT, n = 8 mice; L5a Mecp2-null, n = 10 mice (we excluded the L5a data from mice from which the number of neurons detected in L5a was less than 20). Across both layers, WT, n = 8 mice; Mecp2-null, n = 10 mice. Error bars represent means ± SE. *P < 0.05, **P < 0.01; Wilcoxon signed-rank test. (C) DCC of neurons across M1 L2/3 and L5a. WT, n = 8 mice; Mecp2-null, n = 10 mice. Error bars represent means ± SE. *P < 0.05, RM-ANOVA test.

