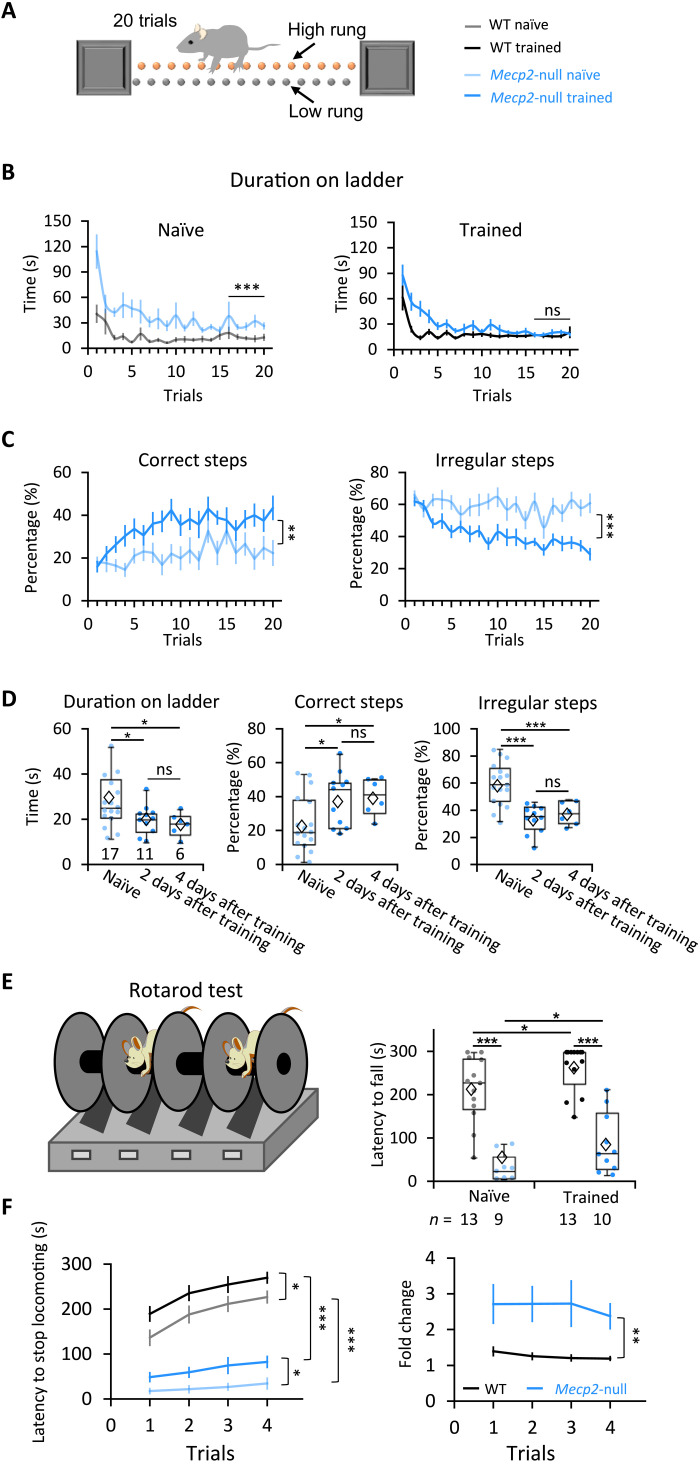
Fig. 5. Motor learning improved coordination of Mecp2-null mice in different assays.
(A) The ladder test as a measure of coordination. The animals run from one end to the other 20 times (20 trials). (B) How much time it took for mice to walk from one end of the ladder to the other. Naïve: WT, n = 15; Mecp2-null, n = 17; trained: WT, n = 19; Mecp2-null, n = 17. (C) Averaged percentage of correct and irregular steps at each trial. In (B) and (C): **P < 0.01 and ***P < 0.001, RM-ANOVA test. (D) Performance parameters from the last five trials of the ladder test 2 or 4 days after wheel training ended (for trained mice) or from age-matched naïve mice. Naïve: n = 17 mice; 2 days after training: n = 11 mice; 4 days after training: n = 6 mice. Error bars represent means (diamond) ± SE. *P < 0.05 and ***P < 0.001, one-way ANOVA test with Fisher’s least significant difference post hoc test. (E) Latency to fall in the first trial of the accelerating rotarod test 2 days after training. The number of mice examined is presented in each column. Error bars represent means ± SE. *P < 0.05 and ***P < 0.001, two-way ANOVA test with Sidak’s post hoc test. (F) Latency to stop locomotion (left) and fold change (right) (calculated as the mouse’s latency to stop divided by the mean value of the naïve mice) on the rotarod for four trials. Naïve: WT, n = 11 mice; Mecp2-null, n = 7 mice; trained: WT, n = 9 mice; Mecp2-null, n = 8 mice. Error bars represent means ± SE. *P < 0.05, **P < 0.01, and ***P < 0.001; RM-ANOVA test.

