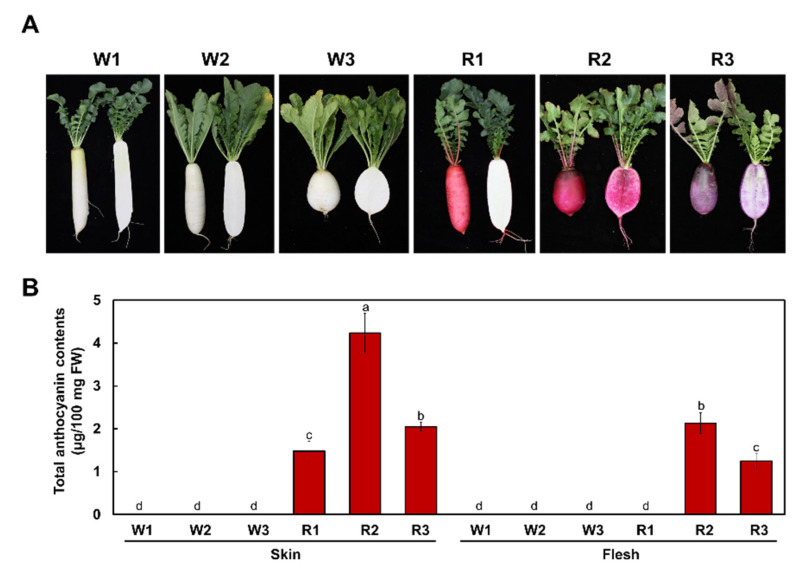
Figure 1.
Phenotypes and anthocyanin contents of the six radish cultivars used in this study. (A) Representative photographs of white- and red-taproot radishes at the mature stage, with whole taproots on the left and taproots sectioned to show flesh color on the right of each image. (B) Anthocyanin levels in white and red taproot radishes. Results are mean values ± SD from three independent biological replicates. Different letters above the bars indicate significantly different values (p < 0.0001, one-way ANOVA followed by Duncan’s multiple range test).

