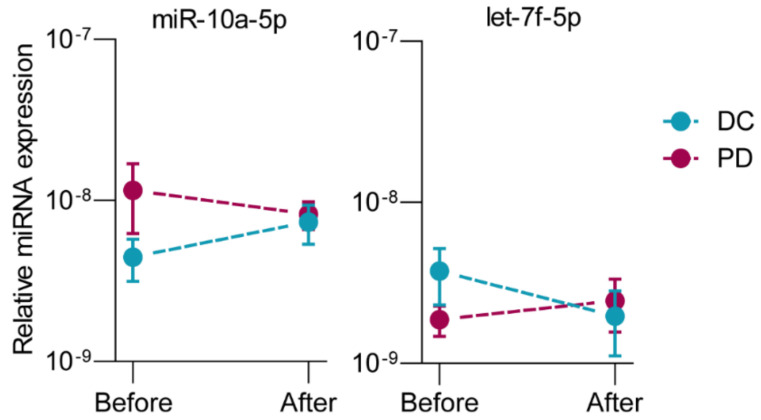
Figure 2.
Changes in serum miRNA expression over time measured before start of FOLFIRINOX and after one cycle of FOLFIRINOX with opposite directions between patients with disease control (DC, n = 6) and progressive disease (PD, n = 6) in the discovery cohort. Data are presented as average FD, relative to the expression of the two reference miRNAs, with standard deviations. p-values were calculated with paired t-tests.

