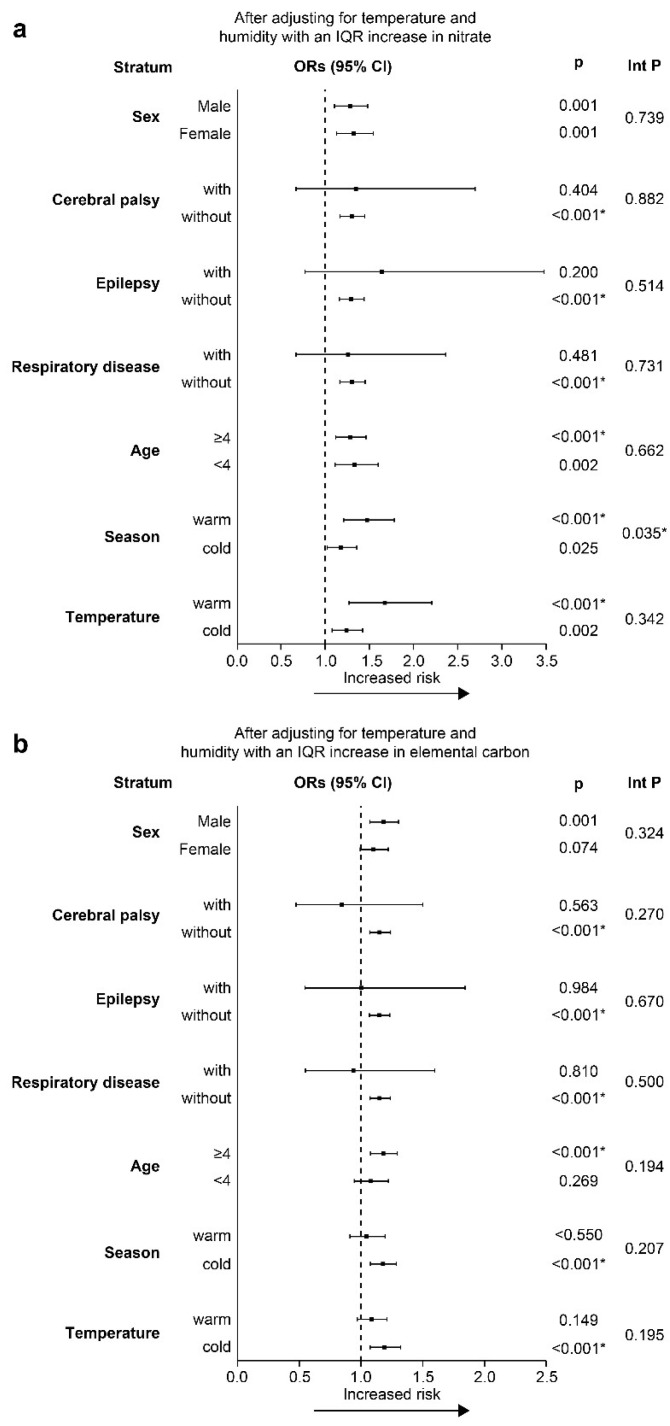
Figure 4.
Adjusted ORs and CI of subgroup analysis for PM2.5 constituents on lag 3: (a) nitrate, (b) elemental carbon. The X-axis represents percentage of excess risk with 95% confidence intervals. Warm season was defined as April through September; cold season as October through March. Warm temperature, ≧26.5 °C; cold temperature, <26.5 °C. CI, confidence intervals; Int P, interaction p value; IQR, interquartile range; OR, odds ratio; PM, particulate matter. * p < 0.05.

